

Question: a. Fill in the table. Include a minus sign (-) for any negative values entered below. (1) (2) (3) Labour Marginal (4) (workers per Total
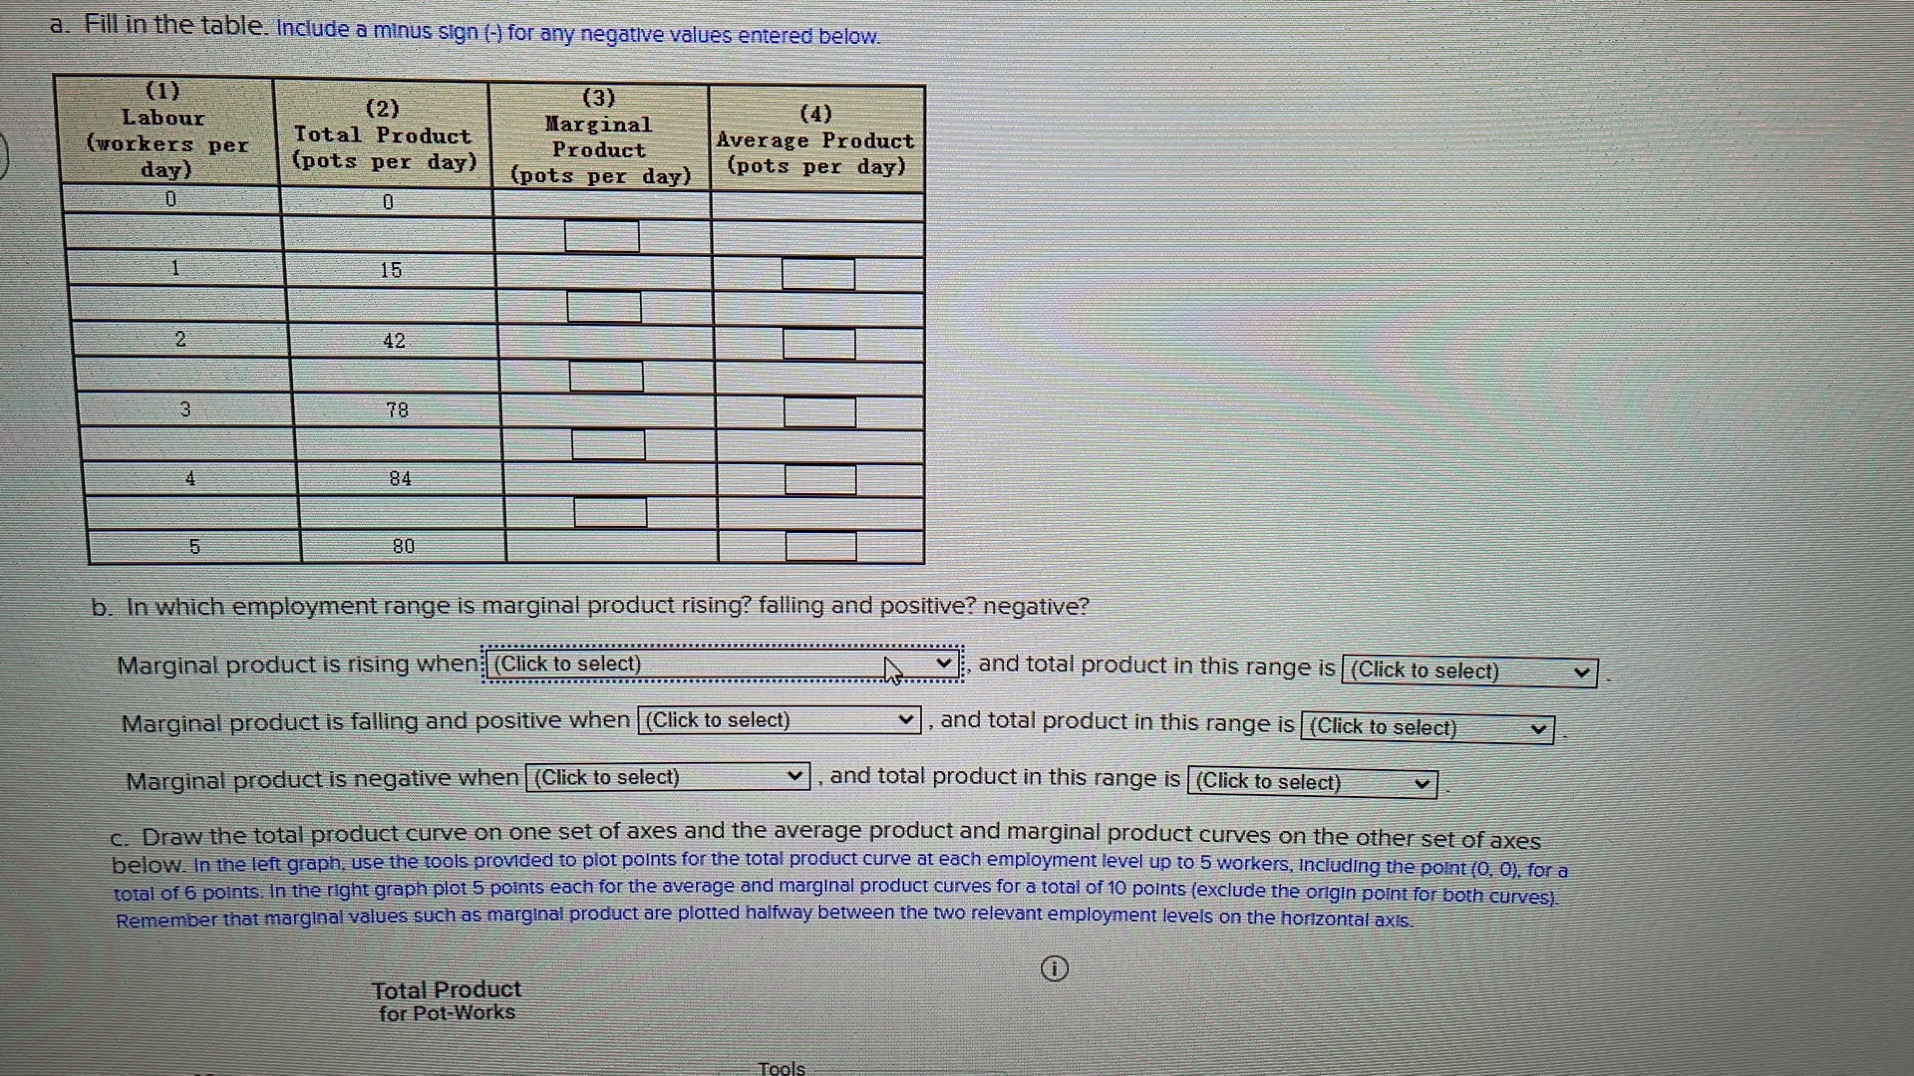
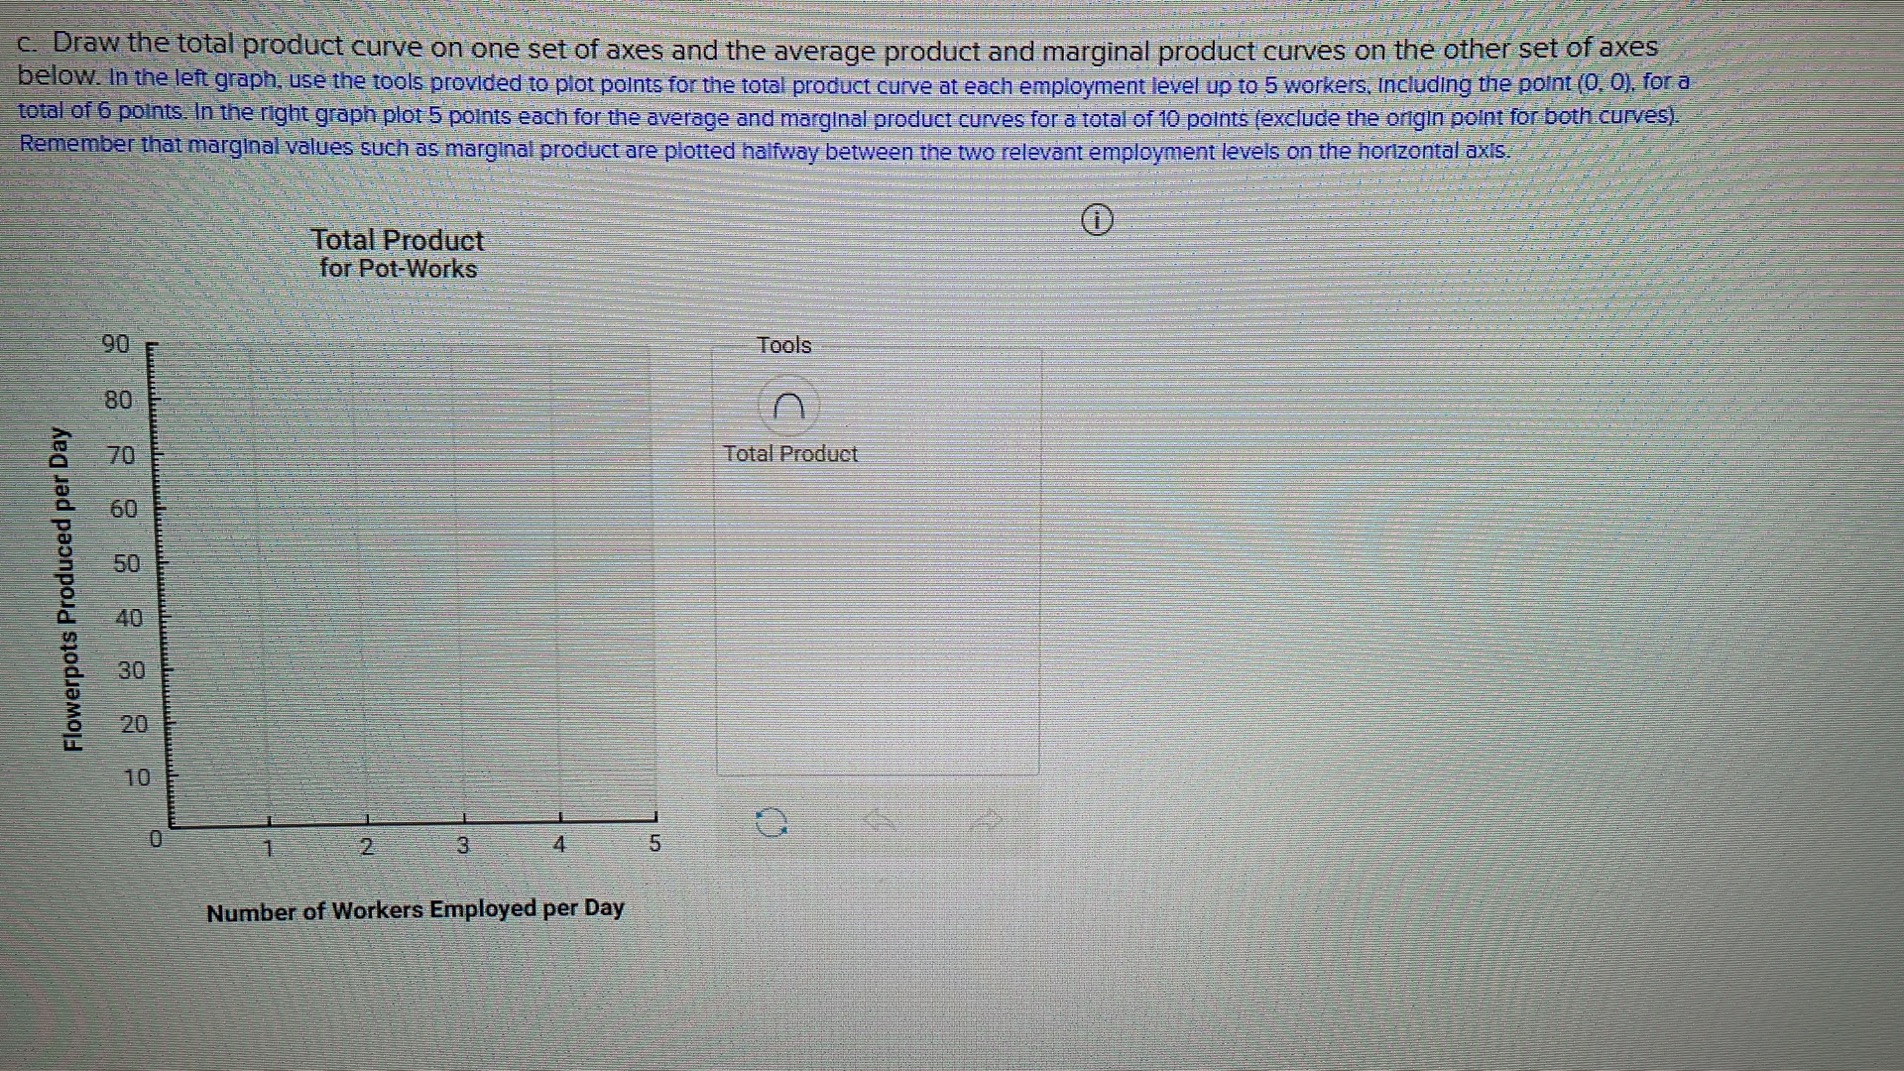
a. Fill in the table. Include a minus sign (-) for any negative values entered below. (1) (2) (3) Labour Marginal (4) (workers per Total Product (pots per day) Product Average Product day) (pots per day) (pots per day) 0 0 1 15 2 12 78 84 5 80 b. In which employment range is marginal product rising? falling and positive? negative? Marginal product is rising when (Click to select) , and total product in this range is (Click to select) Marginal product is falling and positive when (Click to select) v, and total product in this range is |(Click to select) Marginal product is negative when |(Click to select) v, and total product in this range is (Click to select) c. Draw the total product curve on one set of axes and the average product and marginal product curves on the other set of axes below. In the left graph, use the tools provided to plot points for the total product curve at each employment level up to 5 workers, Including the point (0, 0), for a total of 6 points. In the right graph plot 5 points each for the average and marginal product curves for a total of 10 points (exclude the origin point for both curves). Remember that marginal values such as marginal product are plotted halfway between the two relevant employment levels on the horizontal axis. Total Product for Pot-Worksc. Draw the total product curve on one set of axes and the average product and marginal product curves on the other set of axes below. In the left graph, use the tools provided to plot points for the total product curve at each employment level up to 5 workers, Including the point (0, 0), for a total of 6 points. In the right graph plot 5 points each for the average and marginal product curves for a total of 10 points (exclude the origin point for both curves) Remember that marginal values such as marginal product are plotted halfway between the two relevant employment levels on the horizontal axis. Total Product for Pot-Works 90 Tools 80 A 70 Total Product 50 Flowerpots Produced per Day 40 30 20 10 Number of Workers Employed per Day
Step by Step Solution
There are 3 Steps involved in it

Get step-by-step solutions from verified subject matter experts