

Question: a. Find lambda () b. Find mu () c. Find rho () for the single server model and fill in the chart. d. Find P0
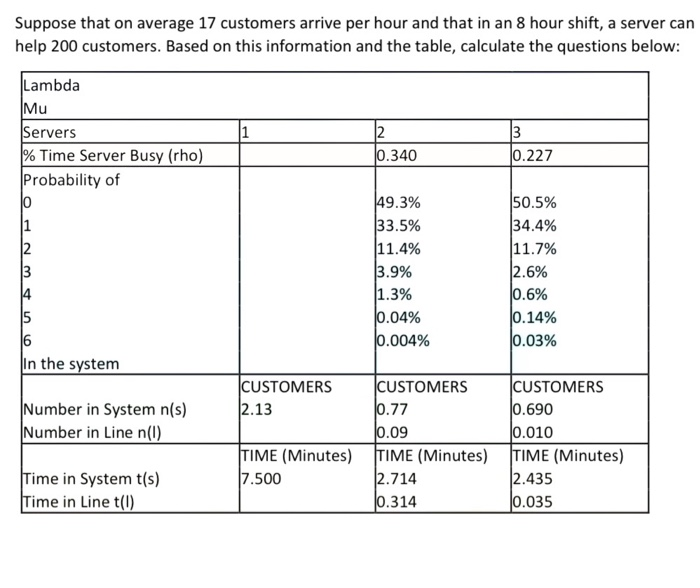
a. Find lambda ()
b. Find mu ()
c. Find rho () for the single server model and fill in the chart.
d. Find P0 to P6 for the single server model and fill in the chart.
these are the answers I just need to show the work: a. 0.283 b. 0.417 c. 0.68 or 68% d. P0=32%,P1=21.8%,P2=14.8%,P3=10.1%,P4=6.8%,P5=4.7%,P6=3.2%
Step by Step Solution
There are 3 Steps involved in it
1 Expert Approved Answer
Step: 1 Unlock

Question Has Been Solved by an Expert!
Get step-by-step solutions from verified subject matter experts
Step: 2 Unlock
Step: 3 Unlock