

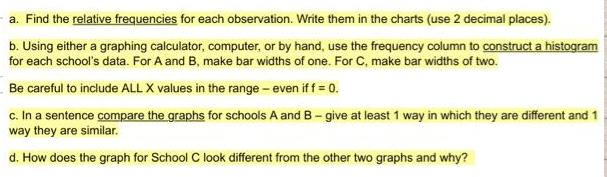
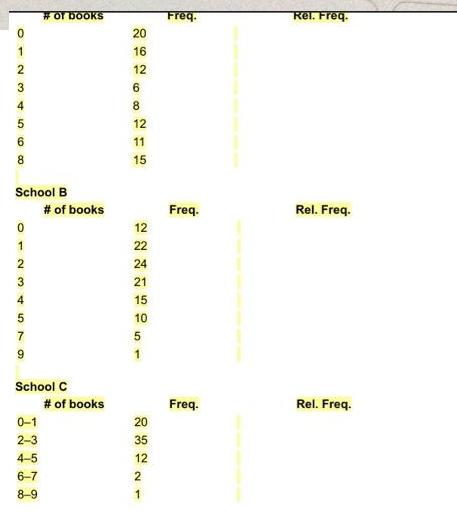
a. Find the relative frequencies for each observation. Write them in the charts (use 2 decimal...
Fantastic news! We've Found the answer you've been seeking!
Question:
Expert Answer:

Posted Date:
