

Question: (a) Find the value for r. Round your answer to at least three decimal places. r~ 0.991 Part: 1 / 3 Part 2 of 3
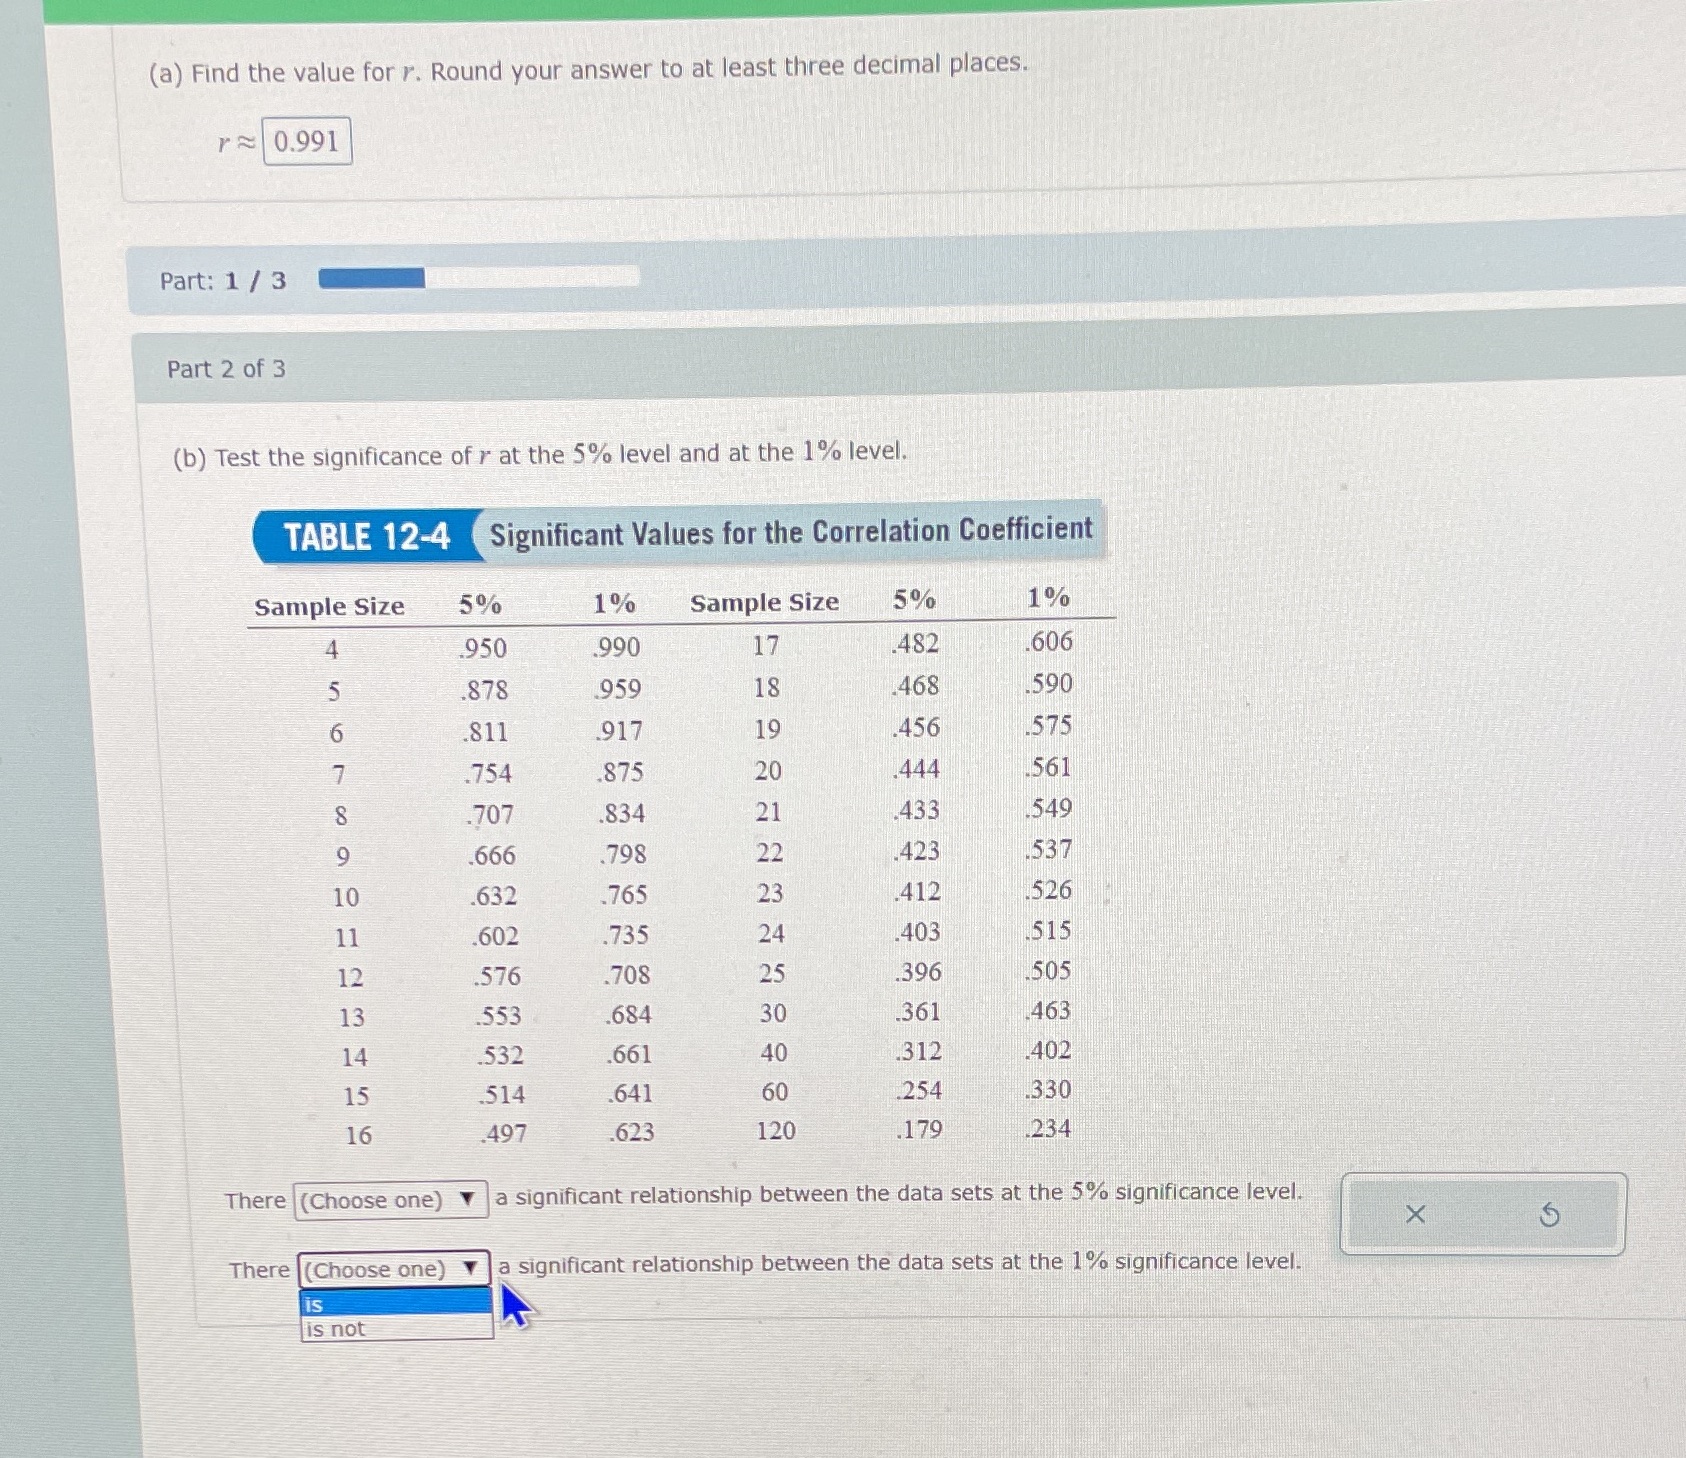
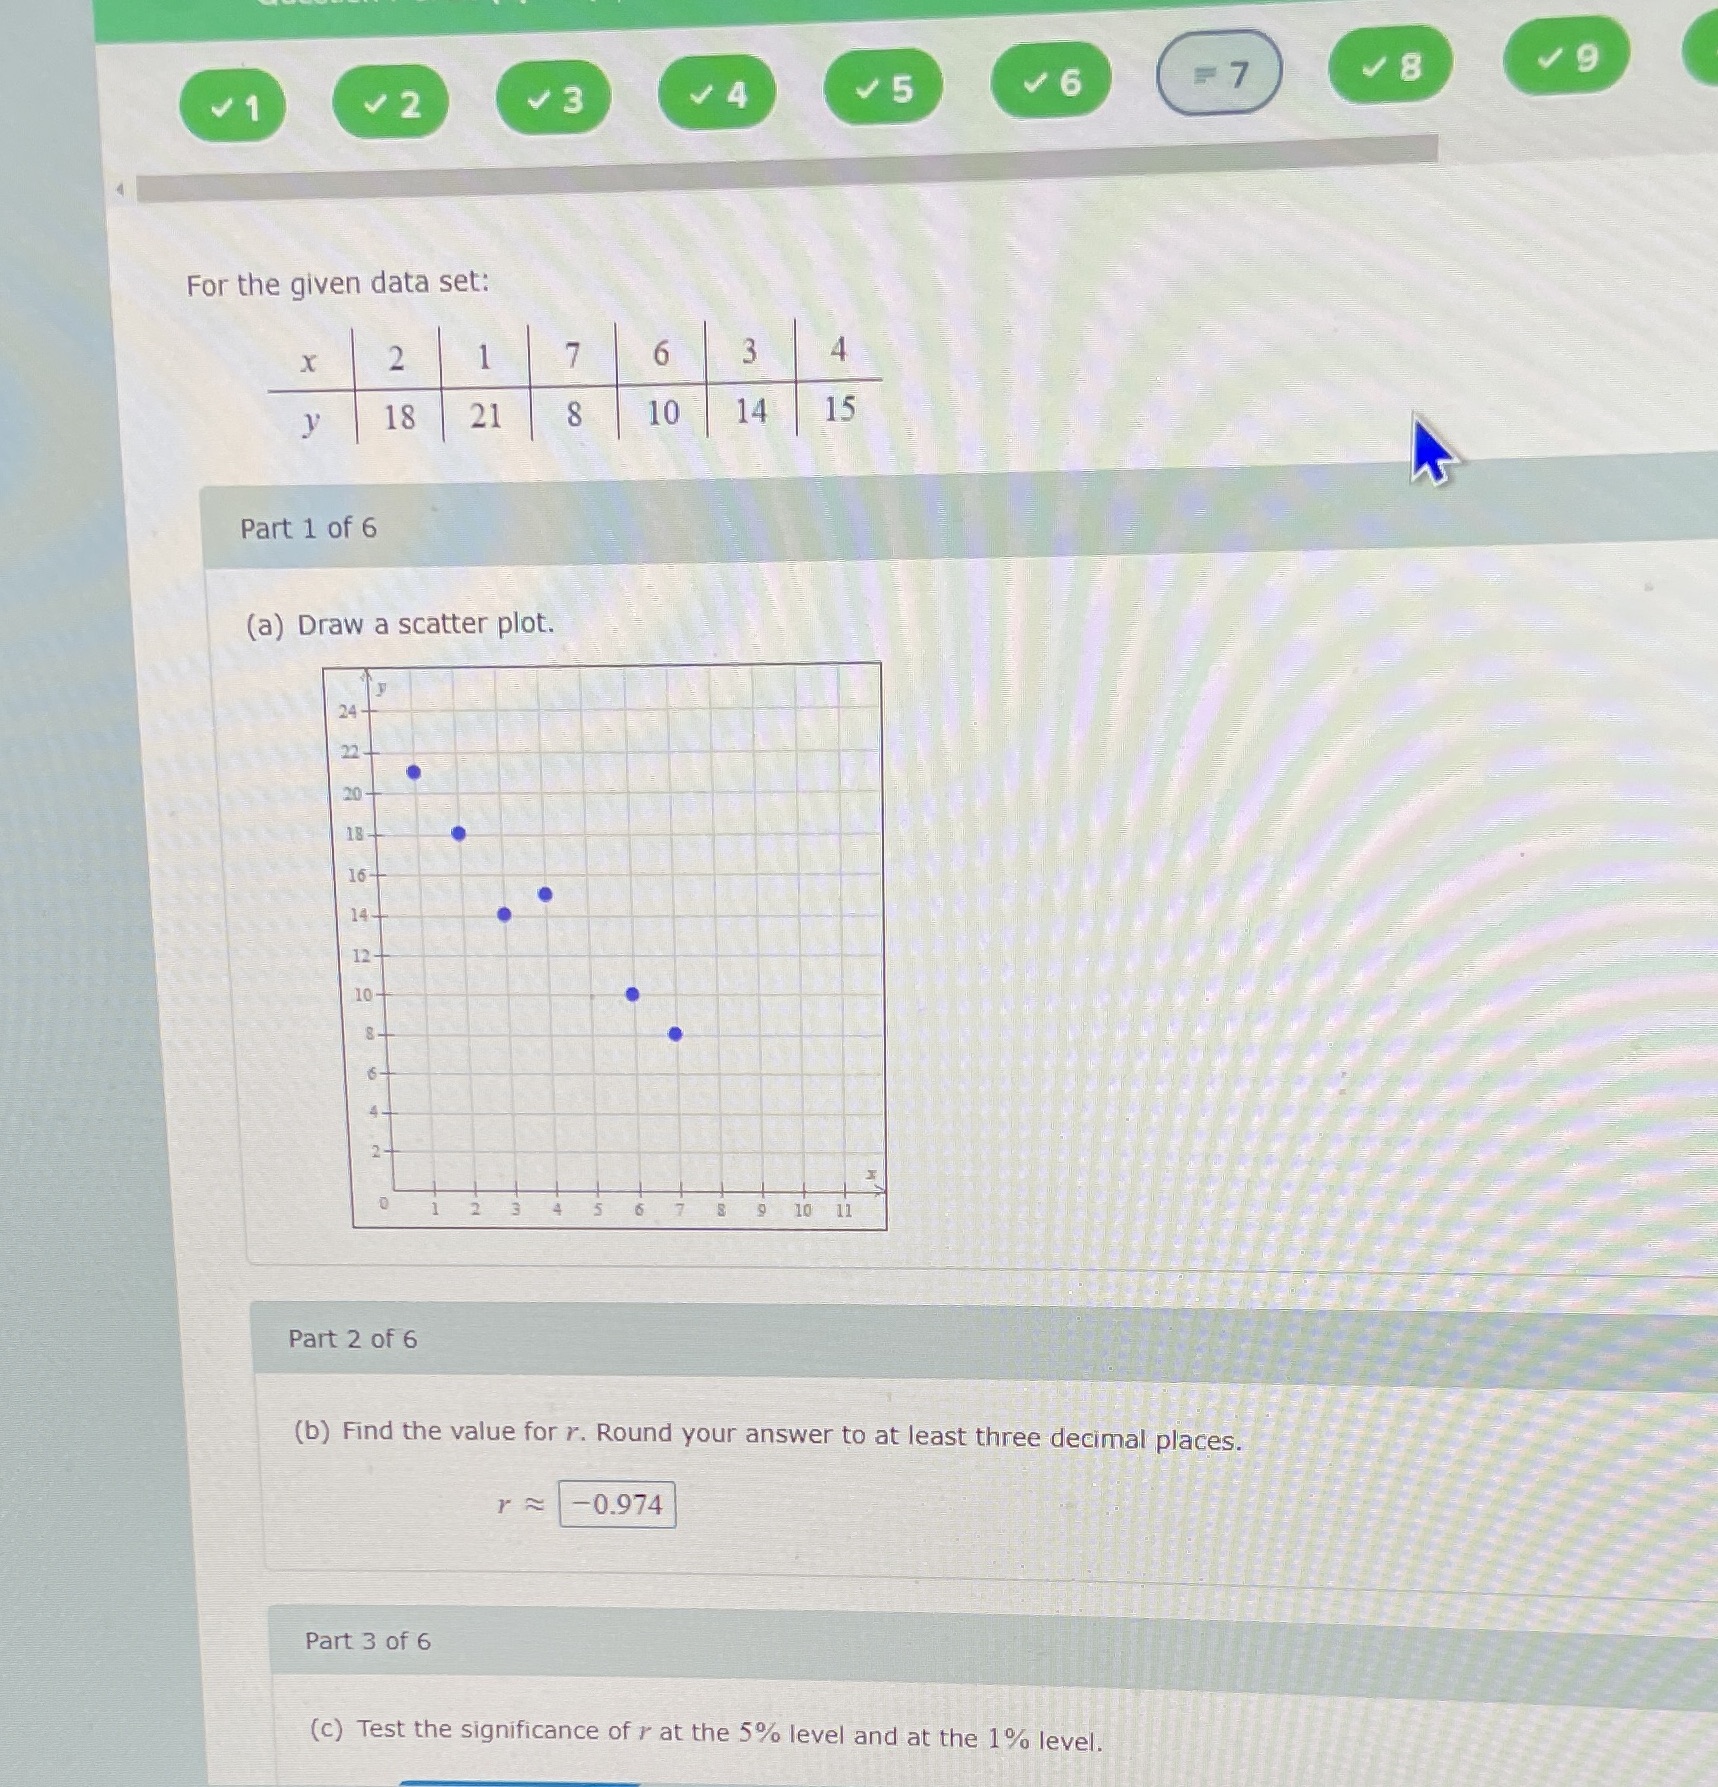
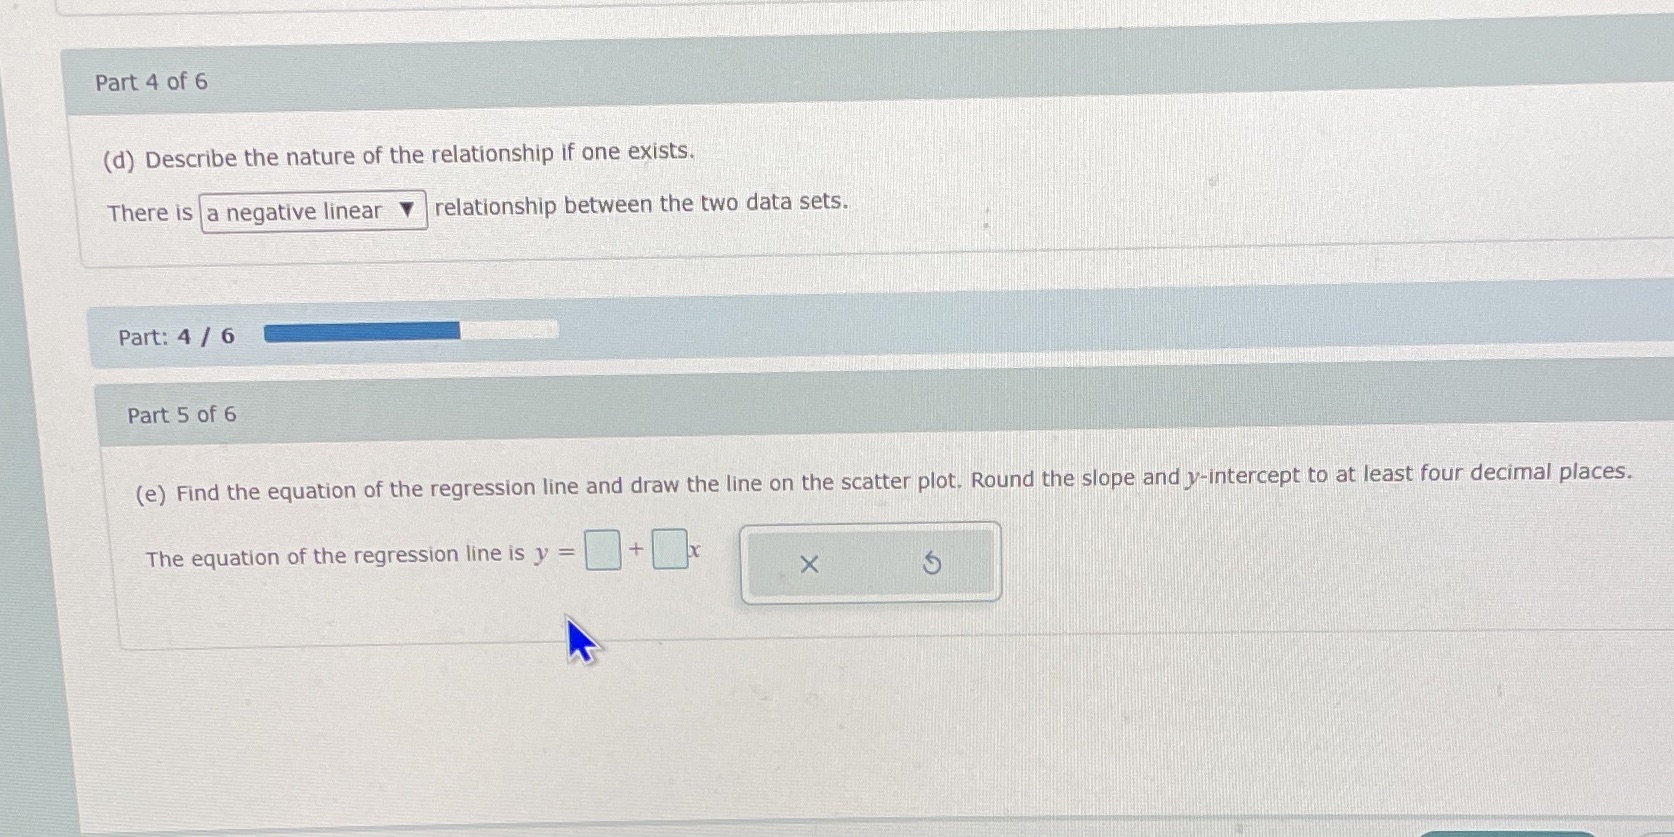
(a) Find the value for r. Round your answer to at least three decimal places. r~ 0.991 Part: 1 / 3 Part 2 of 3 (b) Test the significance of r at the 5% level and at the 1% level. TABLE 12-4 Significant Values for the Correlation Coefficient Sample Size 5% 1% Sample Size 5% 1% 4 950 990 17 482 506 878 959 18 468 590 811 917 19 456 575 754 875 20 .444 .561 707 834 21 .433 .549 .666 798 22 423 537 10 .632 765 23 .412 526 602 735 24 .403 515 12 .576 .708 25 396 505 13 .553 .684 30 .361 463 14 .532 .661 40 .312 .402 15 514 .641 60 .254 330 16 497 623 120 179 234 There (Choose one) Y a significant relationship between the data sets at the 5% significance level. X There (Choose one) | |a significant relationship between the data sets at the 1% significance level. is not~1 2 V3 4 5 16 For the given data set: X 2 6 3 18 21 8 10 14 15 Part 1 of 6 (a) Draw a scatter plot. 24- 22- 20- 18- 16- 14- 12- 10- 10 Part 2 of 6 (b) Find the value for r. Round your answer to at least three decimal places. 0.974 Part 3 of 6 (c) Test the significance of r at the 5% level and at the 1% level.Part 4 of 6 (d) Describe the nature of the relationship if one exists. There is a negative linear relationship between the two data sets. Part: 4 / 6 Part 5 of 6 (e) Find the equation of the regression line and draw the line on the scatter plot. Round the slope and y-intercept to at least four decimal places. The equation of the regression line is y X
Step by Step Solution
There are 3 Steps involved in it

Get step-by-step solutions from verified subject matter experts