

Question: A fishbone diagram would be used to: plot the effects of problems over time. categorize potential causes of a problem. plot the frequency of problems.
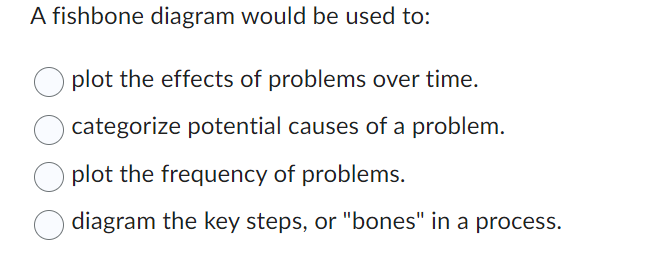
A fishbone diagram would be used to:
plot the effects of problems over time.
categorize potential causes of a problem.
plot the frequency of problems.
diagram the key steps, or "bones" in a process.
Step by Step Solution
There are 3 Steps involved in it
1 Expert Approved Answer
Step: 1 Unlock

Question Has Been Solved by an Expert!
Get step-by-step solutions from verified subject matter experts
Step: 2 Unlock
Step: 3 Unlock