

Question: A fitted linear statistical model equation is y = 12.4 + 5.4 Age + 3.1 Male + 0.4 Height where Age is the age
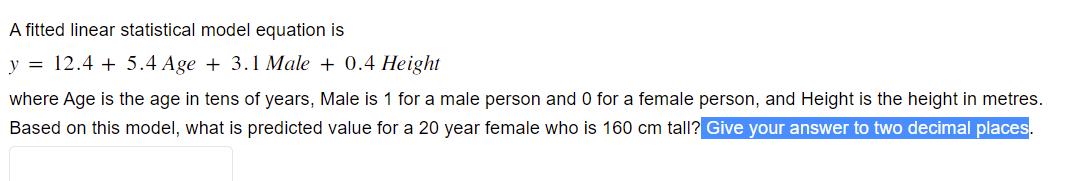
A fitted linear statistical model equation is y = 12.4 + 5.4 Age + 3.1 Male + 0.4 Height where Age is the age in tens of years, Male is 1 for a male person and 0 for a female person, and Height is the height in metres. Based on this model, what is predicted value for a 20 year female who is 160 cm tall? Give your answer to two decimal places.
Step by Step Solution
★★★★★
3.51 Rating (151 Votes )
There are 3 Steps involved in it
1 Expert Approved Answer
Step: 1 Unlock

y 124 54 Age 31 Male 04 Height Let us note the variable values ... View full answer
Question Has Been Solved by an Expert!
Get step-by-step solutions from verified subject matter experts
Step: 2 Unlock
Step: 3 Unlock