

Question: a) Fixed costs; Variable costs and Mixed costs (semi-variable). b) Separate from mixed costs variable cost (per unit) and fixed costs per week. Please show
a) Fixed costs; Variable costs and Mixed costs (semi-variable).
b) Separate from mixed costs variable cost (per unit) and fixed costs per week. Please show calculations.
c) calculate total production fixed costs per week.
d) total production variable cost per unit.
e) total non-production variable cost per unit?
f) total non-production fixed costs per week.
g) total fixed costs per week
h) total variable cost per unit?
i) If the selling price of the product is $ 7.00, how much is the contribution margin per unit?
j) If the selling price of the product is 7.00, What is the break-even point in units?
k) If (Table 5) selling price is $8.00 , commission increases to $ 1.20 per unit . How much is the contribution margin per unit? What is the break-even point in units?
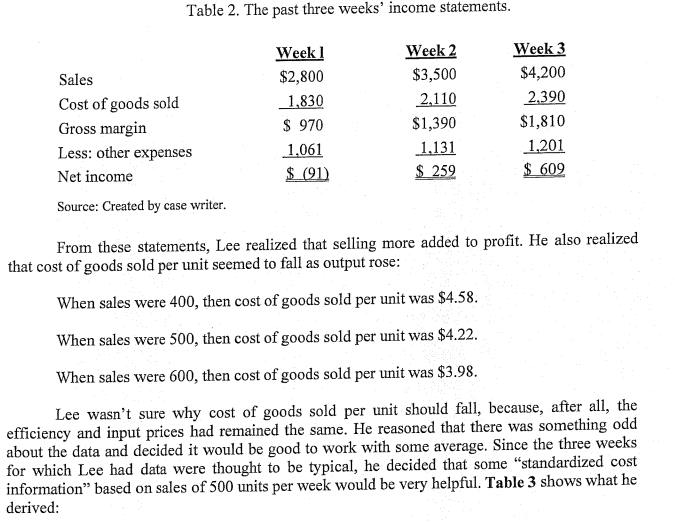
Table 2. The past three weeks' income statements. From these statements, Lee realized that selling more added to profit. He also realized that cost of goods sold per unit seemed to fall as output rose: When sales were 400 , then cost of goods sold per unit was $4.58. When sales were 500 , then cost of goods sold per unit was $4.22. When sales were 600 , then cost of goods sold per unit was $3.98. Lee wasn't sure why cost of goods sold per unit should fall, because, after all, the efficiency and input prices had remained the same. He reasoned that there was something odd about the data and decided it would be good to work with some average. Since the three weeks for which Lee had data were thought to be typical, he decided that some "standardized cost information" based on sales of 500 units per week would be very helpful. Table 3 shows what he derived: Table 2. The past three weeks' income statements. From these statements, Lee realized that selling more added to profit. He also realized that cost of goods sold per unit seemed to fall as output rose: When sales were 400 , then cost of goods sold per unit was $4.58. When sales were 500 , then cost of goods sold per unit was $4.22. When sales were 600 , then cost of goods sold per unit was $3.98. Lee wasn't sure why cost of goods sold per unit should fall, because, after all, the efficiency and input prices had remained the same. He reasoned that there was something odd about the data and decided it would be good to work with some average. Since the three weeks for which Lee had data were thought to be typical, he decided that some "standardized cost information" based on sales of 500 units per week would be very helpful. Table 3 shows what he derived
Step by Step Solution
There are 3 Steps involved in it

Get step-by-step solutions from verified subject matter experts