

Question: a) Follow the steps explained in class 13-adjusted Forecasting and calculate a sales forecast for product Asese in the high Tech segment in 2024 (show
- a) Follow the steps explained in class 13-adjusted Forecasting and calculate a sales forecast for product Asese in the high Tech segment in 2024 (show the difference between traditional and adjusted forecasting, and calculate both the best case and worst case in both). b) calculate the expected market share for the New product Bold inthe high Tech segment in 2024
-
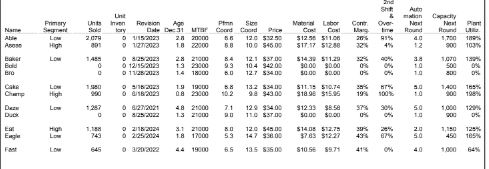
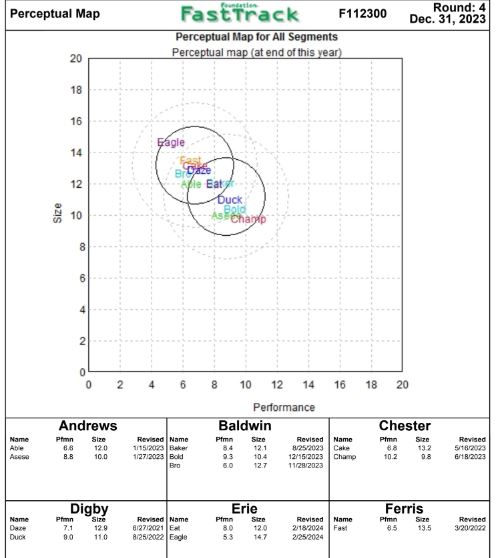
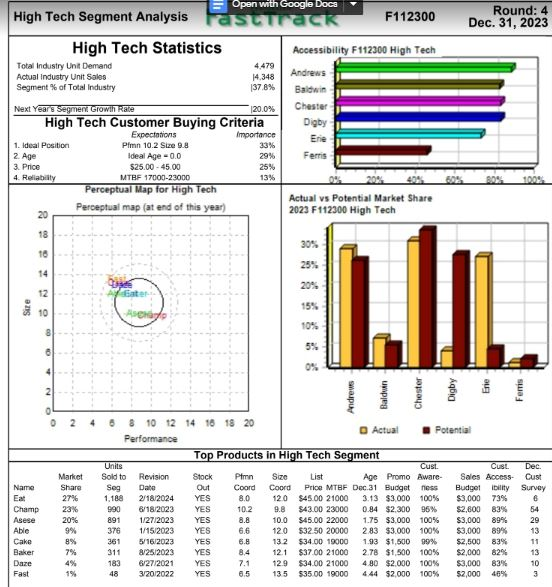
High Tech Segment Analysis Open with Google Docs F112300 F112300 Round: 4 Dec. 31, 2023 Accessibility F112300 High Tech High Tech Statistics Total Industry Unit Demand Actual Industry Unit Sales Segment % of Total Industry 4479 14 348 137.8% Next Year's Segment Growih Rate 120.0% High Tech Customer Buying Criteria Expectations Importance 1. Ideal Position Pfmn 10.2 Size 9.8 2. Age Ideal Age -0.0 3. Price 525.00 - 45.00 25% 4. Reliability MTBF 17000-23000 Perceptual Map for High Tech Perceptual map (at end of this year) Andrews Baldwin Chester Digby Erie Ferris 29% 13% Actual vs Potential Market Share 2023 F112300 High Tech Site Andrews Erie Baldwin Chester Digby Ferris 0 2 4 6 14 16 18 20 8 10 12 Performance Actual Potential Units Sold to Seg 1,188 Dec. Cust Survey Market Share 27% 23% Name 990 Top Products in High Tech Segment Cust. Stock Ptmn Size List Age Promo Aware- Out Coord Coord Price MTBF Dec 31 Budgetness YES 8.0 120 $45.00 21000 3.13 $3.000 100% YES 10.2 9.8 $43.00 23000 0.84 $2,300 96% YES 8.8 10.0 $45.00 22000 1.75 $3.000 100% YES 6.6 120 532 50 20000 283 $3.000 100% YES 6. 8 1 32 $34.00 19000 1.93 $1.500 99% YES 8.4 12.1 $37.00 21000 2.78 $1,500 100% YES 7.1 12.9 $34.00 21000 4.80 $2.000 100% YES 6.5 13 5 $35.00 19000 444 $2.000 100% Asese 20% 891 Revision Date 2/1812024 6/18/2023 1/27/2023 1/15/2023 5/16/2023 8/25/2023 6/27/2021 3/2012022 Cust. Sales Acons Budgetibility $3,000 73% $2,800 83% $3,000 89% $3.000 89% $2,500 83% $2,000 82% $3,000 83% $2,000 45% 29 Abie 8% Cake Baker Daze Fast 361 311 183 10 3 Come Units to lory OverNet Revision Age Porn Se ber Date Di The CoordPreCol Cost B 109 54500 SIT 17 $123 TOON 23 21000 81252024 11252028 $0.00 $ 8000 09120241919000 08 23000 8 132 $34.00 $11.19 510.7 0 71 129 $3400 272021 48 21000 8220221.3 21000 1.000 120 31 147 33800 52004 03/20 2022 $1239 $8.50 $0.00 $0.00 $14.03 $12.79 3783 31227 S10 Se 59.74 0 53 65 18 17000 4419000 120 48.00 147 33800 135 536.00 1.000 64% Perceptual Map FastTrack F112300 Dec. 19,2023 Perceptual Map for All Segments Perceptual map (at end of this year) pie Eat Duck BO als Chapip 0 2 4 6 16 18 20 8 10 12 14 Performance Baldwin Pfmn Size Revised Chester Andrews Pfmn Size 120 8.8 100 Name Revised Name 115/2008 Baker 1272023 Bold Pm Size 88 132 10208 Revised S82003 12021 93 50 104 12.7 1215/2023 11/29/2023 Cho Digby Pi n e 71129 90 110 Revised Name $ 27.2001 25.2002 Edge Erie Size 30 20 53 147 Revised Name 2018 2024 Fast 2252034 Ferris Pin e 85 135 20/2003 High Tech Segment Analysis Open with Google Docs F112300 F112300 Round: 4 Dec. 31, 2023 Accessibility F112300 High Tech High Tech Statistics Total Industry Unit Demand Actual Industry Unit Sales Segment % of Total Industry 4479 14 348 137.8% Next Year's Segment Growih Rate 120.0% High Tech Customer Buying Criteria Expectations Importance 1. Ideal Position Pfmn 10.2 Size 9.8 2. Age Ideal Age -0.0 3. Price 525.00 - 45.00 25% 4. Reliability MTBF 17000-23000 Perceptual Map for High Tech Perceptual map (at end of this year) Andrews Baldwin Chester Digby Erie Ferris 29% 13% Actual vs Potential Market Share 2023 F112300 High Tech Site Andrews Erie Baldwin Chester Digby Ferris 0 2 4 6 14 16 18 20 8 10 12 Performance Actual Potential Units Sold to Seg 1,188 Dec. Cust Survey Market Share 27% 23% Name 990 Top Products in High Tech Segment Cust. Stock Ptmn Size List Age Promo Aware- Out Coord Coord Price MTBF Dec 31 Budgetness YES 8.0 120 $45.00 21000 3.13 $3.000 100% YES 10.2 9.8 $43.00 23000 0.84 $2,300 96% YES 8.8 10.0 $45.00 22000 1.75 $3.000 100% YES 6.6 120 532 50 20000 283 $3.000 100% YES 6. 8 1 32 $34.00 19000 1.93 $1.500 99% YES 8.4 12.1 $37.00 21000 2.78 $1,500 100% YES 7.1 12.9 $34.00 21000 4.80 $2.000 100% YES 6.5 13 5 $35.00 19000 444 $2.000 100% Asese 20% 891 Revision Date 2/1812024 6/18/2023 1/27/2023 1/15/2023 5/16/2023 8/25/2023 6/27/2021 3/2012022 Cust. Sales Acons Budgetibility $3,000 73% $2,800 83% $3,000 89% $3.000 89% $2,500 83% $2,000 82% $3,000 83% $2,000 45% 29 Abie 8% Cake Baker Daze Fast 361 311 183 10 3 Come Units to lory OverNet Revision Age Porn Se ber Date Di The CoordPreCol Cost B 109 54500 SIT 17 $123 TOON 23 21000 81252024 11252028 $0.00 $ 8000 09120241919000 08 23000 8 132 $34.00 $11.19 510.7 0 71 129 $3400 272021 48 21000 8220221.3 21000 1.000 120 31 147 33800 52004 03/20 2022 $1239 $8.50 $0.00 $0.00 $14.03 $12.79 3783 31227 S10 Se 59.74 0 53 65 18 17000 4419000 120 48.00 147 33800 135 536.00 1.000 64% Perceptual Map FastTrack F112300 Dec. 19,2023 Perceptual Map for All Segments Perceptual map (at end of this year) pie Eat Duck BO als Chapip 0 2 4 6 16 18 20 8 10 12 14 Performance Baldwin Pfmn Size Revised Chester Andrews Pfmn Size 120 8.8 100 Name Revised Name 115/2008 Baker 1272023 Bold Pm Size 88 132 10208 Revised S82003 12021 93 50 104 12.7 1215/2023 11/29/2023 Cho Digby Pi n e 71129 90 110 Revised Name $ 27.2001 25.2002 Edge Erie Size 30 20 53 147 Revised Name 2018 2024 Fast 2252034 Ferris Pin e 85 135 20/2003
Step by Step Solution
There are 3 Steps involved in it

Get step-by-step solutions from verified subject matter experts