

Question: a) For an osmotic pump to work is it necessary for the drug concentration to be higher than the total solute concentration in the blood?
a) For an osmotic pump to work is it necessary for the drug concentration to be higher than the total solute concentration in the blood? Explain. (b) Is it necessary for the osmogen concentration in the osmogene chamber to be higher than the total solute concentration in the blood?
: At which times do you expect there to be the highest concentration of drug in the blood in graph A? How about in graph B? Think about the differences between the y-axis label -- drug concentration in the blood vs. cumulative amount of drug released carefully! Estimate the time range from .. to .. in hours for this question.
Bonus point: How could you interpret the data, if the y-axis just said drug and the description only said that we plotted the drug amount versus time?
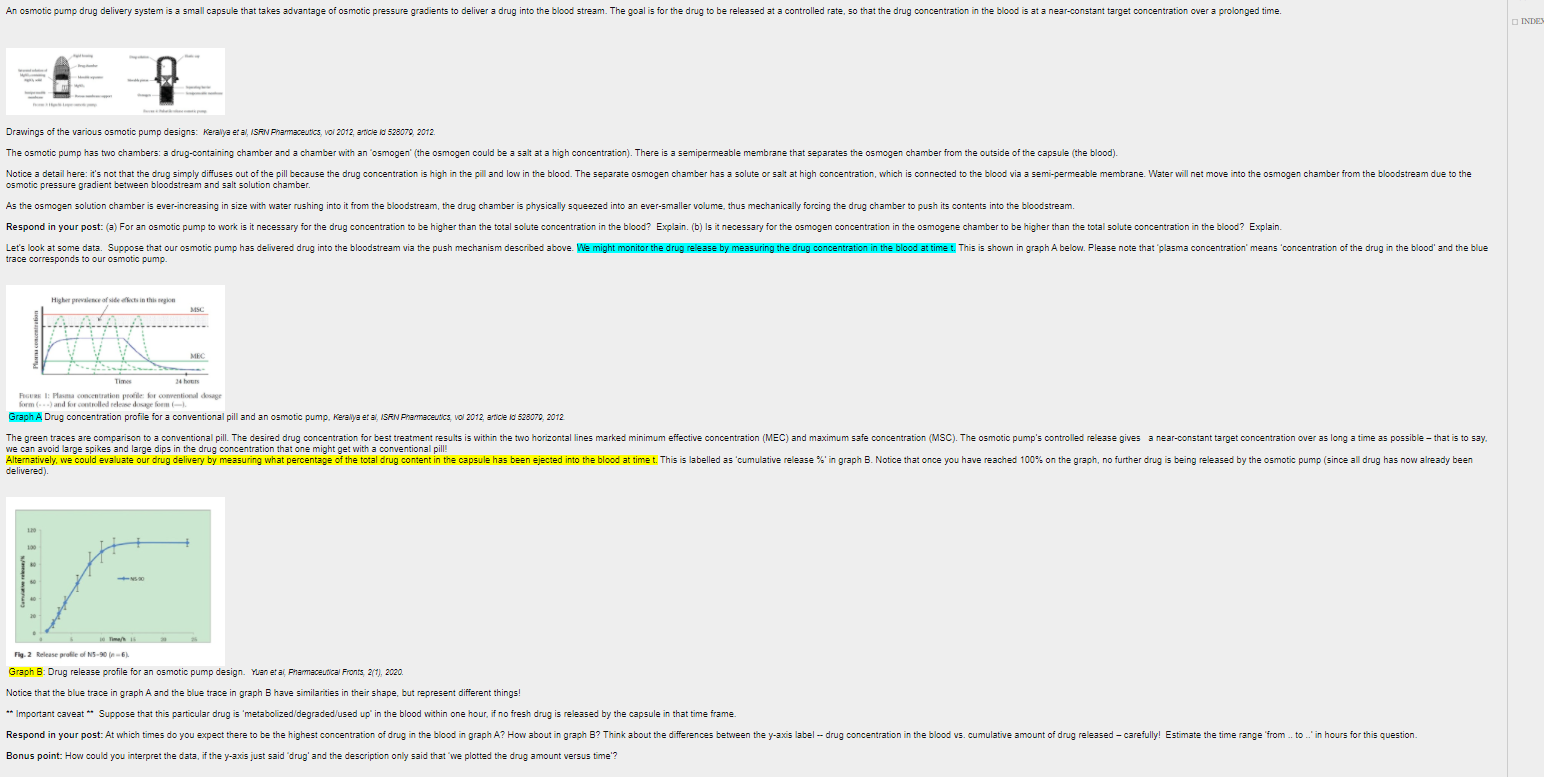
An osmotic pump drug delivery system is a small capsule that takes advantage of osmotic pressure gradients to deliver a drug into the blood stream. The goal is for the drug to be released at a controlled rate, so that the drug concentration in the blood is at a near-constant target concentration over a prolonged time. INDE Drawings of the various osmotic pump designs: Keralya et al, ISAIN Pharmaceutics, Vol 2012, article is 525079, 2012 The osmotic pump has two chambers: a drug-containing chamber and a chamber with an 'osmogen' (the osmogen could be a salt at a high concentration). There is a semipermeable membrane that separates the osmogen chamber from the outside of the capsule (the blood). Notice a detail here: it's not that the drug simply diffuses out of the pill because the drug concentration is high in the pill and low in the blood. The separate osmogen chamber has a solute or salt at high concentration, which is connected to the blood via a semi-permeable membrane. Water will net move into the osmogen chamber from the bloodstream due to the osmotic pressure gradient between bloodstream and salt solution chamber. As the osmogen solution chamber is ever-increasing in size with water rushing into it from the bloodstream, the drug chamber is physically squeezed into an ever-smaller volume, thus mechanically forcing the drug chamber to push its contents into the bloodstream. Respond in your post: (a) For an osmotic pump to work is it necessary for the drug concentration to be higher than the total solute concentration in the blood? Explain. (b) Is it necessary for the osmogen concentration in the osmogene chamber to be higher than the total solute concentration in the blood? Explain. Let's look at some data. Suppose that our osmotic pump has delivered drug into the bloodstream via the push mechanism described above. We might monitor the drug release by measuring the drug concentration in the blood at timet. This is shown in graph A below. Please note that plasma concentration' means 'concentration of the drug in the blood' and the blue trace corresponds to our osmotic pump. Higher price of side effects in this region MSC MEC Ti 34 FIGUR 1: Plasma concentration profile for conventional dosage formand for stored Graph A Drug concentration profile for a conventional pill and an osmotic pump, Kerallya et al, Ise Pharmaceutics V 2012, article id 528070, 2012 The green traces are comparison to a conventional pill. The desired drug concentration for best treatment results is within the two horizontal lines marked minimum effective concentration (MEC) and maximum safe concentration (MSC). The osmotic pump's controlled release gives a near-constant target concentration over as long a time as possible that is to say we can avoid large spikes and large dips in the drug concentration that one might get with a conventional pill! Alternatively, we could evaluate our drug delivery by measuring what percentage of the total drug content in the capsule has been ejected into the blood at timet. This is labelled as 'cumulative release in graph B. Notice that once you have reached 100% on the graph, no further drug is being released by the osmotic pump (since all drug has now already been delivered) Fig. 2 Release profile of N5-90-6) Graph B: Drug release profile for an osmotic pump design. Yaneta Pharmaceutical Fronts 2(1), 2020. Notice that the blue trace in graph A and the blue trace in graph B have similarities in their shape, but represent different things! ** Important caveat ** Suppose that this particular drug is 'metabolized/degraded/used up in the blood within one hour, if no fresh drug is released by the capsule in that time frame Respond in your post: At which times do you expect there to be the highest concentration of drug in the blood in graph A? How about in graph B? Think about the differences between the y-axis label -- drug concentration in the blood vs. cumulative amount of drug released - carefully! Estimate the time range from .. to... in hours for this question. Bonus point: How could you interpret the data, if the y-axis just said 'drug' and the description only said that we plotted the drug amount versus time? An osmotic pump drug delivery system is a small capsule that takes advantage of osmotic pressure gradients to deliver a drug into the blood stream. The goal is for the drug to be released at a controlled rate, so that the drug concentration in the blood is at a near-constant target concentration over a prolonged time. INDE Drawings of the various osmotic pump designs: Keralya et al, ISAIN Pharmaceutics, Vol 2012, article is 525079, 2012 The osmotic pump has two chambers: a drug-containing chamber and a chamber with an 'osmogen' (the osmogen could be a salt at a high concentration). There is a semipermeable membrane that separates the osmogen chamber from the outside of the capsule (the blood). Notice a detail here: it's not that the drug simply diffuses out of the pill because the drug concentration is high in the pill and low in the blood. The separate osmogen chamber has a solute or salt at high concentration, which is connected to the blood via a semi-permeable membrane. Water will net move into the osmogen chamber from the bloodstream due to the osmotic pressure gradient between bloodstream and salt solution chamber. As the osmogen solution chamber is ever-increasing in size with water rushing into it from the bloodstream, the drug chamber is physically squeezed into an ever-smaller volume, thus mechanically forcing the drug chamber to push its contents into the bloodstream. Respond in your post: (a) For an osmotic pump to work is it necessary for the drug concentration to be higher than the total solute concentration in the blood? Explain. (b) Is it necessary for the osmogen concentration in the osmogene chamber to be higher than the total solute concentration in the blood? Explain. Let's look at some data. Suppose that our osmotic pump has delivered drug into the bloodstream via the push mechanism described above. We might monitor the drug release by measuring the drug concentration in the blood at timet. This is shown in graph A below. Please note that plasma concentration' means 'concentration of the drug in the blood' and the blue trace corresponds to our osmotic pump. Higher price of side effects in this region MSC MEC Ti 34 FIGUR 1: Plasma concentration profile for conventional dosage formand for stored Graph A Drug concentration profile for a conventional pill and an osmotic pump, Kerallya et al, Ise Pharmaceutics V 2012, article id 528070, 2012 The green traces are comparison to a conventional pill. The desired drug concentration for best treatment results is within the two horizontal lines marked minimum effective concentration (MEC) and maximum safe concentration (MSC). The osmotic pump's controlled release gives a near-constant target concentration over as long a time as possible that is to say we can avoid large spikes and large dips in the drug concentration that one might get with a conventional pill! Alternatively, we could evaluate our drug delivery by measuring what percentage of the total drug content in the capsule has been ejected into the blood at timet. This is labelled as 'cumulative release in graph B. Notice that once you have reached 100% on the graph, no further drug is being released by the osmotic pump (since all drug has now already been delivered) Fig. 2 Release profile of N5-90-6) Graph B: Drug release profile for an osmotic pump design. Yaneta Pharmaceutical Fronts 2(1), 2020. Notice that the blue trace in graph A and the blue trace in graph B have similarities in their shape, but represent different things! ** Important caveat ** Suppose that this particular drug is 'metabolized/degraded/used up in the blood within one hour, if no fresh drug is released by the capsule in that time frame Respond in your post: At which times do you expect there to be the highest concentration of drug in the blood in graph A? How about in graph B? Think about the differences between the y-axis label -- drug concentration in the blood vs. cumulative amount of drug released - carefully! Estimate the time range from .. to... in hours for this question. Bonus point: How could you interpret the data, if the y-axis just said 'drug' and the description only said that we plotted the drug amount versus time
Step by Step Solution
There are 3 Steps involved in it

Get step-by-step solutions from verified subject matter experts