

Question: a.) For the data plot above, choose the graph below with the best linear maodel displayed 1 2 4 6 8 10 12 14 2
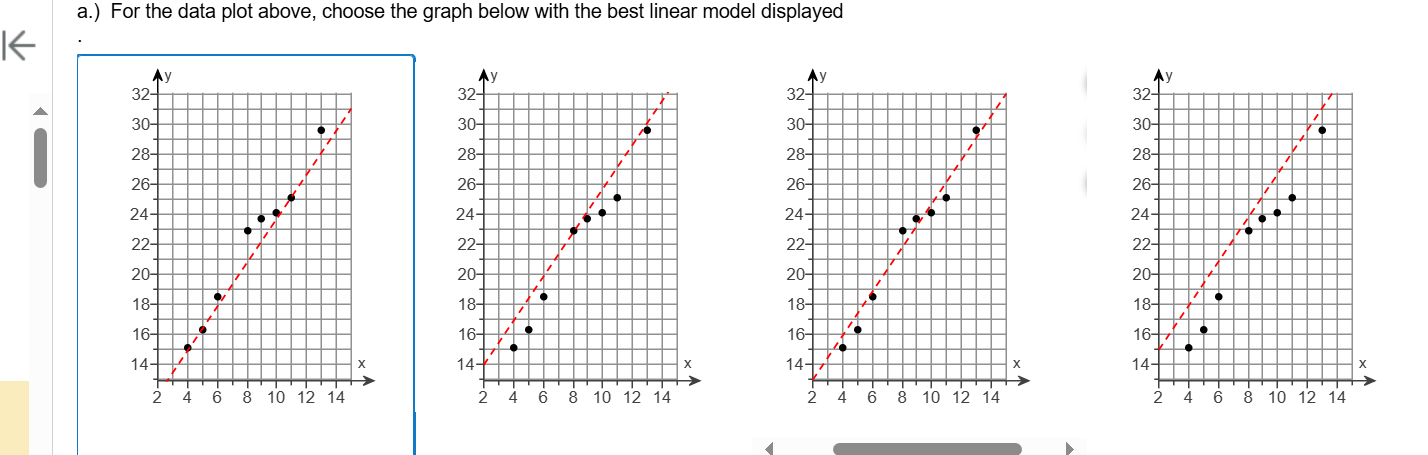

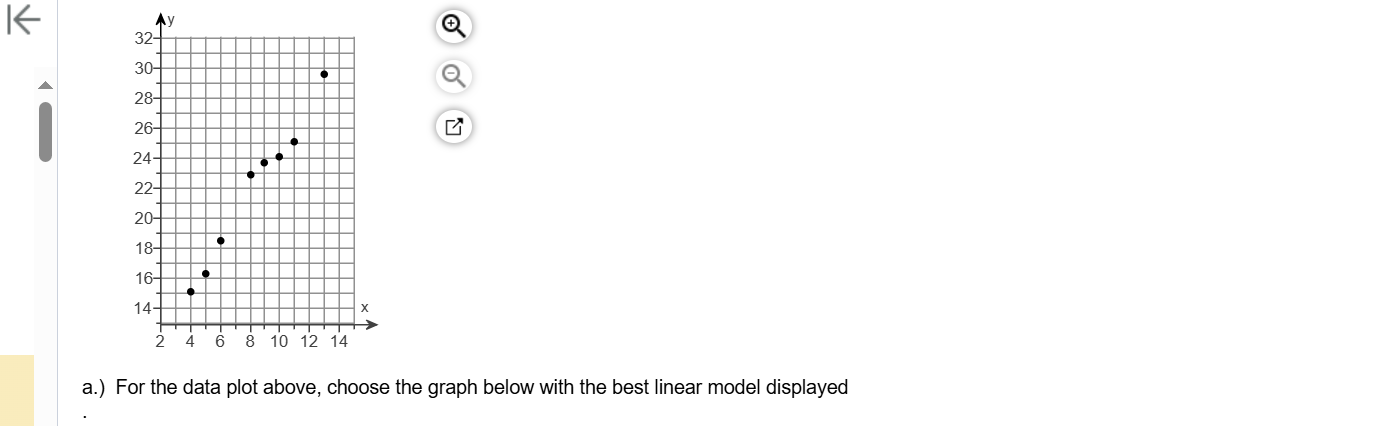
a.) For the data plot above, choose the graph below with the best linear maodel displayed 1 2 4 6 8 10 12 14 2 4 6 8 10 12 14 2 4 6 8 10 12 14 2 4 6 8 10 12 14 b.) Using your choice from part a, find the linear equation in slope intercept form for the model that best fits the data. (Round your answers to 2 decimal places) y=| [x+ 2 4 6 8 10 12 14 a.) For the data plot above, choose the graph below with the best linear model displayed
Step by Step Solution
There are 3 Steps involved in it
1 Expert Approved Answer
Step: 1 Unlock

Question Has Been Solved by an Expert!
Get step-by-step solutions from verified subject matter experts
Step: 2 Unlock
Step: 3 Unlock