

Question: a. For the given sample size, the control limits for 3-sigma x charts are: lower control limit (LCL-/x)=_____ lb (round your response to 3 decimal
a. For the given sample size, the control limits for 3-sigma x charts are:
lower control limit (LCL-/x)=_____ lb (round your response to 3 decimal places).
b. The control limits for the 3-sigma R-charts are:
Upper control limit (UCL R)=____lb (round your response to 3 decimal places).
Lower control limit (LCL R)=_____lb (round your response to 3 decimal places).
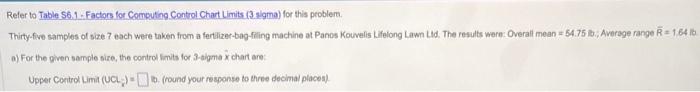
Refer to Table S6.1 . Factars for Computing Control Chart Limits (3 sigma) for this problem. Thirty-five samples of size ? each were taken from a fertlizer-bag-fling machine at Panos Kouvelis L.felong Lawn Lid. The results were: Overall mean =54.75 ib.; Average range R=1. 64 it a) For the given sample sire, the control limits for 3-atgma x chart are: Upper Conteol Limit ( UCL. )= 10. (round your response to three decimal places)
Step by Step Solution
There are 3 Steps involved in it
1 Expert Approved Answer
Step: 1 Unlock

Question Has Been Solved by an Expert!
Get step-by-step solutions from verified subject matter experts
Step: 2 Unlock
Step: 3 Unlock