

Question: Figure 7.8 Determination of the Optimal Overall Portfolio Expected Return (%) 18 16- 14- 12+ 10 8+ 6+ Ff=5% 4 2. 0 Indifference Curve
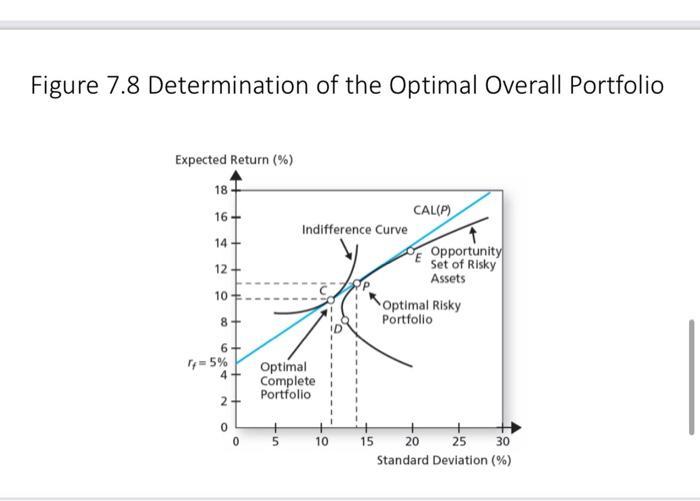
Figure 7.8 Determination of the Optimal Overall Portfolio Expected Return (%) 18 16- 14- 12+ 10 8+ 6+ Ff=5% 4 2. 0 Indifference Curve Optimal Complete Portfolio 0 5 10 CAL(P) Opportunity Set of Risky Assets Optimal Risky Portfolio 15 20 25 30 Standard Deviation (%)
Step by Step Solution
★★★★★
3.42 Rating (155 Votes )
There are 3 Steps involved in it
1 Expert Approved Answer
Step: 1 Unlock

The optimal overall portfolio in the fig 18 is a the e... View full answer
Question Has Been Solved by an Expert!
Get step-by-step solutions from verified subject matter experts
Step: 2 Unlock
Step: 3 Unlock