

Question: a. Formulate null and alternative hypotheses consistent with determining whether the population mean value of analyst As forecast errors (1) are larger than analyst Bs
a. Formulate null and alternative hypotheses consistent with determining whether the population mean value of analyst As forecast errors (1) are larger than analyst Bs (2).
b. Identify the test statistic for conducting a test of the null hypothesis formulated in Part a.
c. Identify the rejection point or points for the hypothesis tested in Part a, at the 0.05 level of significance.
d. Determine whether or not to reject the null hypothesis at the 0.05 level of significance.
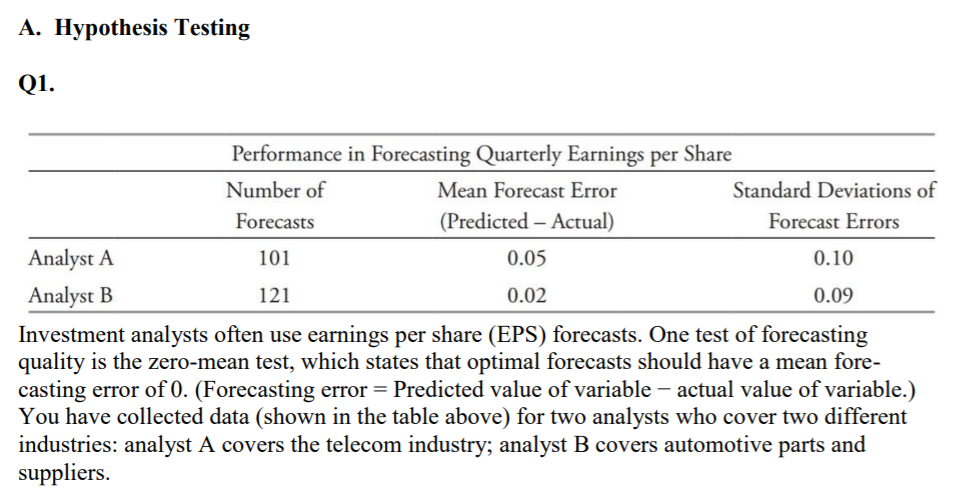
A. Hypothesis Testing Q1. Performance in Forecasting Quarterly Earnings per Share Number of Mean Forecast Error Standard Deviations of Forecasts (Predicted - Actual) Forecast Errors Analyst A 101 0.05 0.10 Analyst B 121 0.02 0.09 Investment analysts often use earnings per share (EPS) forecasts. One test of forecasting quality is the zero-mean test, which states that optimal forecasts should have a mean fore- casting error of 0. (Forecasting error = Predicted value of variable actual value of variable.) You have collected data (shown in the table above) for two analysts who cover two different industries: analyst A covers the telecom industry; analyst B covers automotive parts and suppliers. A. Hypothesis Testing Q1. Performance in Forecasting Quarterly Earnings per Share Number of Mean Forecast Error Standard Deviations of Forecasts (Predicted - Actual) Forecast Errors Analyst A 101 0.05 0.10 Analyst B 121 0.02 0.09 Investment analysts often use earnings per share (EPS) forecasts. One test of forecasting quality is the zero-mean test, which states that optimal forecasts should have a mean fore- casting error of 0. (Forecasting error = Predicted value of variable actual value of variable.) You have collected data (shown in the table above) for two analysts who cover two different industries: analyst A covers the telecom industry; analyst B covers automotive parts and suppliers
Step by Step Solution
There are 3 Steps involved in it

Get step-by-step solutions from verified subject matter experts