

Question: A Frequency Distribution Table using data This list of 16 random numbers has been sorted: begin{tabular}{[c]} hline 20 hline 31 1 hline 40 hline 42
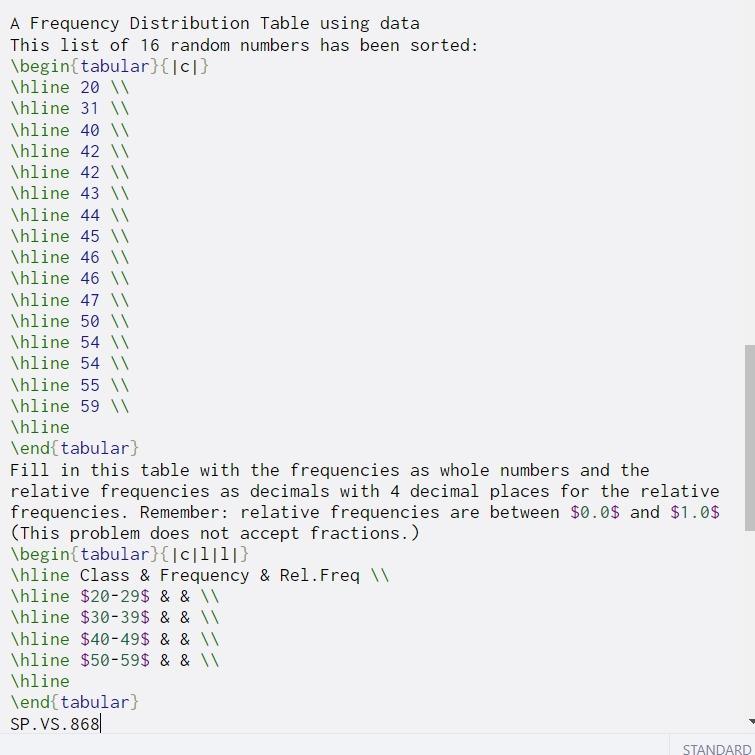
A Frequency Distribution Table using data This list of 16 random numbers has been sorted: \begin{tabular}{[c]} \hline 20 \hline 31 1 \hline 40 \hline 42 \hline 42 \hline 43 \hline 44 \hline 45 \hline 46 \hline 46 \hline 47 \hline 50 \hline 54 \hline 54 \hline 55 \hline 59 \hline \end{tabular) Fill in this table with the frequencies as whole numbers and the relative frequencies as decimals with 4 decimal places for the relative frequencies. Remember: relative frequencies are between $0.0$ and $1.0$ (This problem does not accept fractions.) \begin{tabular}{|c1|1|} \hline Class & Frequency & Rel. Freq \hline $20-29$ & & \hline $30-39$ & & W \hline $40-49$ & & W \hline $50-59$ & & W \hline \end{tabular) SP.VS. 868 STANDARD
Step by Step Solution
There are 3 Steps involved in it

Get step-by-step solutions from verified subject matter experts