

Question: A frequency table is shown below. Find the best estimate of the data mean (weighted mean). Interval Frequency 14-16 4 16-18 2 18-20 20-22 4
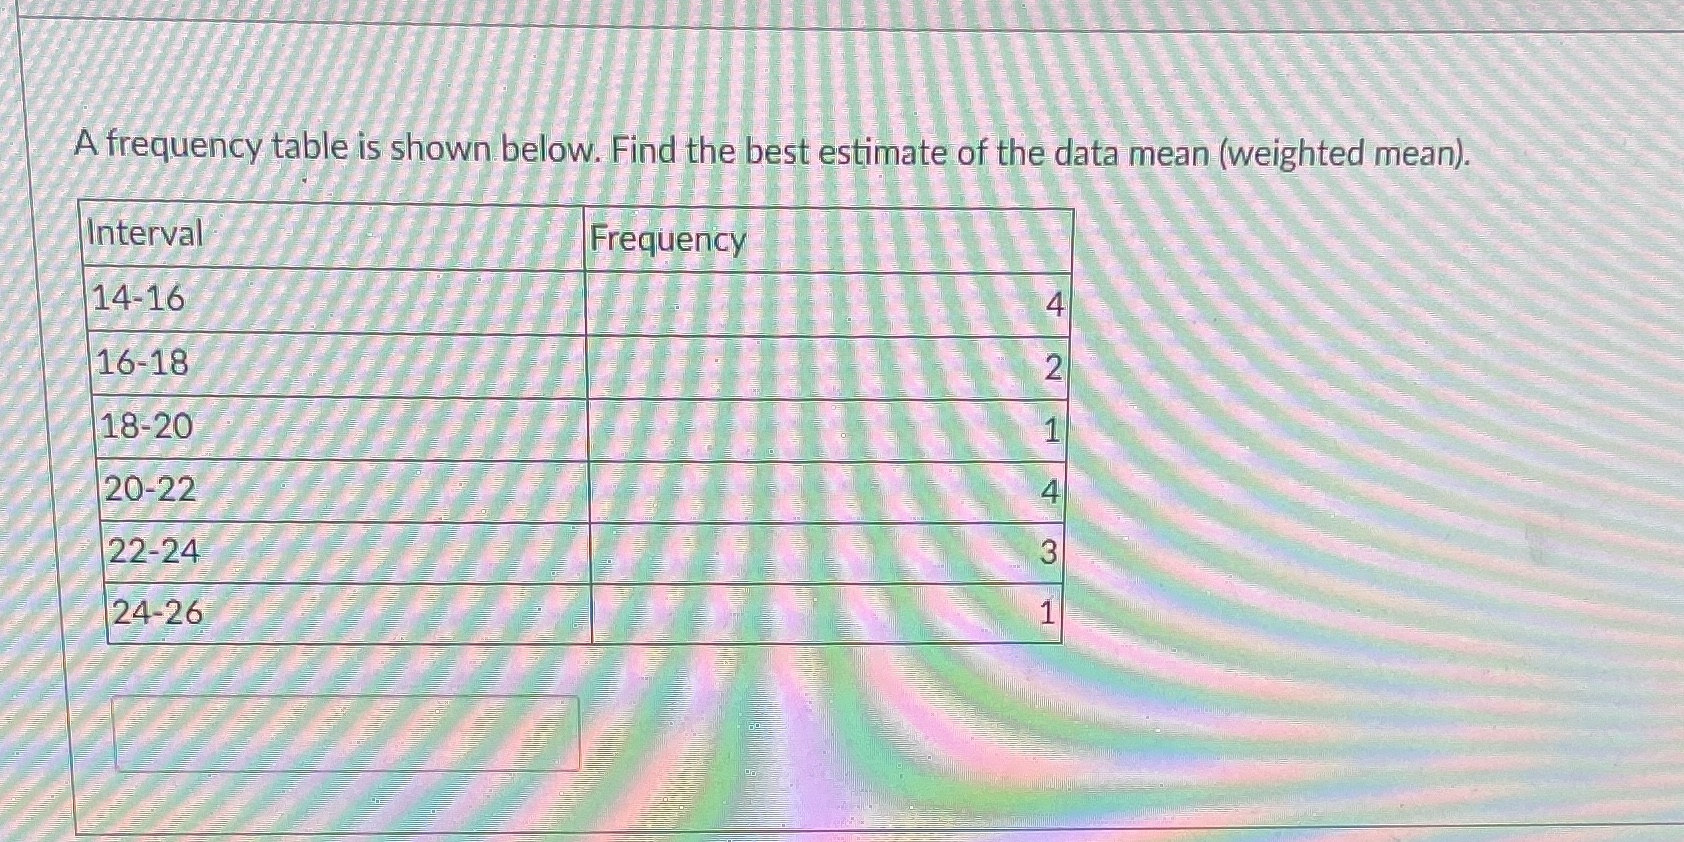
A frequency table is shown below. Find the best estimate of the data mean (weighted mean). Interval Frequency 14-16 4 16-18 2 18-20 20-22 4 22-24 3 24-26
Step by Step Solution
There are 3 Steps involved in it
1 Expert Approved Answer
Step: 1 Unlock

Question Has Been Solved by an Expert!
Get step-by-step solutions from verified subject matter experts
Step: 2 Unlock
Step: 3 Unlock