

Question: A function, f(x, 7), E described below in 3 different ways: with a form ula, witha table and with a contour graph. However, one of
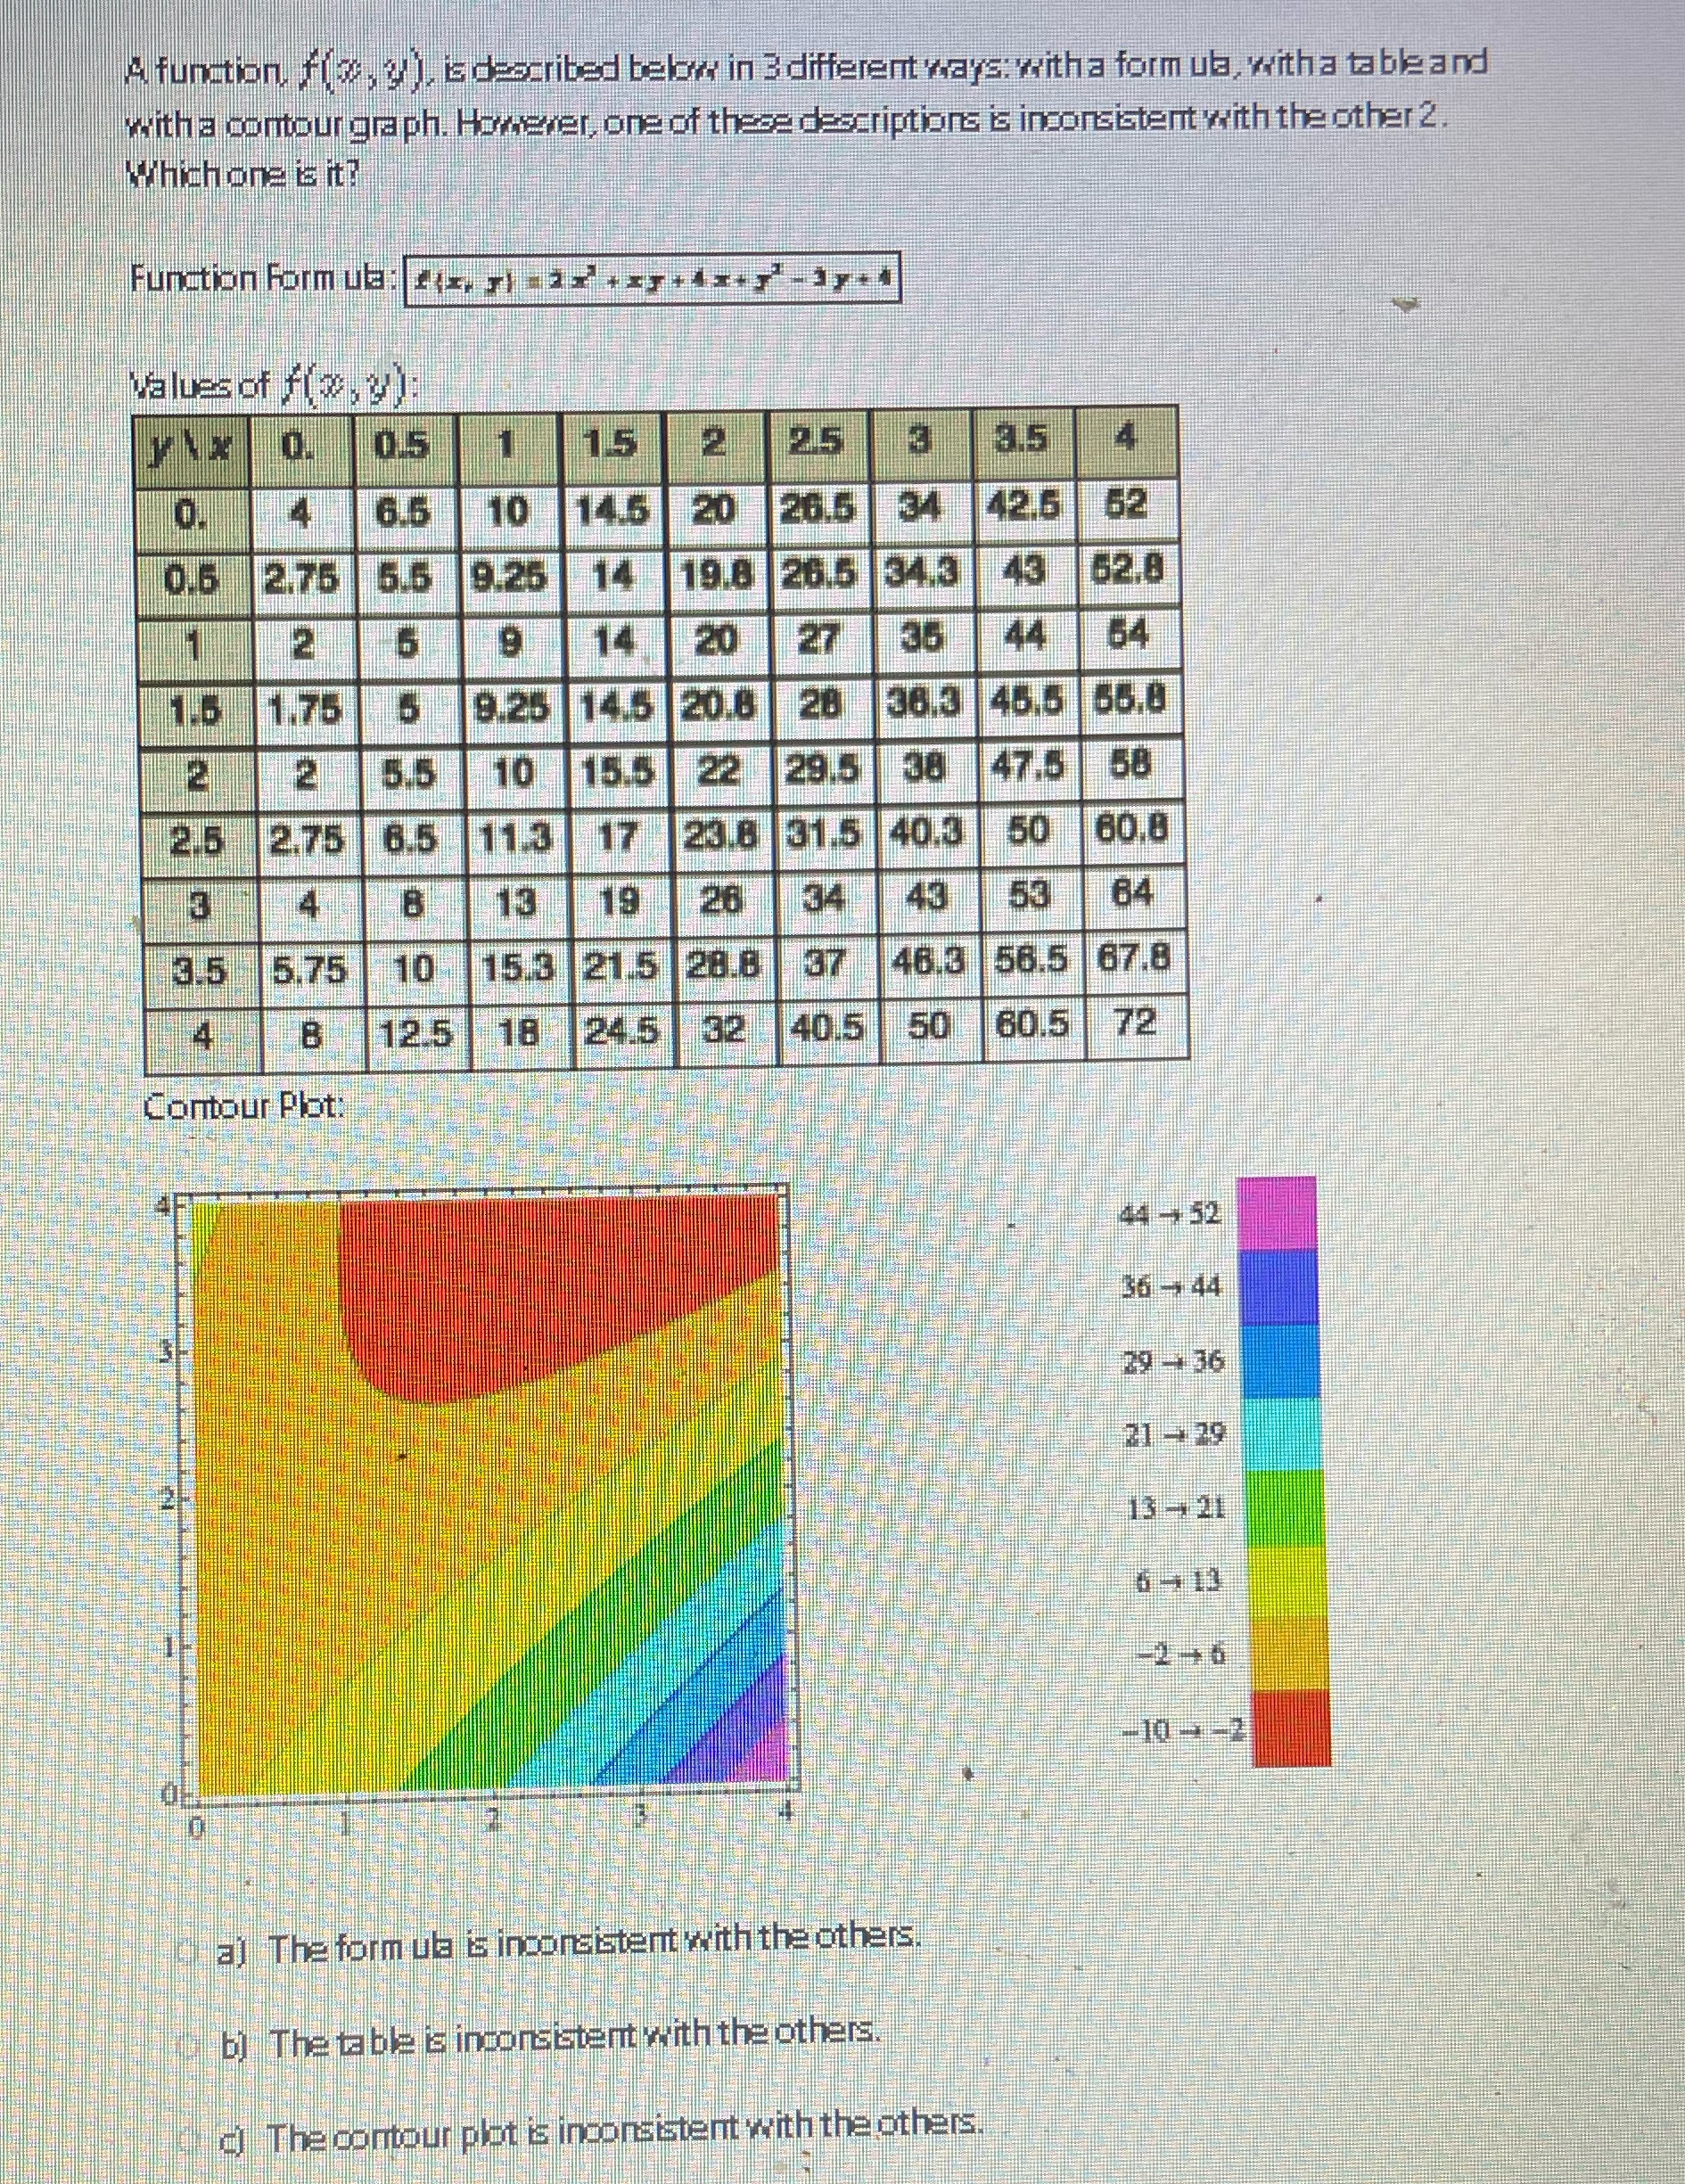

A function, f(x, 7), E described below in 3 different ways: with a form ula, witha table and with a contour graph. However, one of these descriptions is inconsistent with the other 2 Which one is it? Function Formula: (2, 7) =12 + zy+42+-37+4 Values of f(3, (); 0.5 15 215 0. 6.5 10 14.5 26.5 12.6 2.75 5.5 9.26 19.8 26.5 34.3 62.8 n 20 27 36 1.75 9.25 14.5 20.8 28 36.3 45.5 55.8 2 2 10 15.5 22 29.5 38 47.5 58 2.5 2.75 6.5 11.3 17 23.8 31.5 40.3 50 60.8 20 34 64 3.5 5.75 10 15.3 21.5 28.8 46.3 56.5 67.8 12.5 18 24.5 32 40.5 50 60.5 72 Contour Plot 44 - 52 36 - 44 29 - 36 21 - 29 13 - 21 6- 13 -2-+6 -10 - -2 a) The form ula i inconsistent with the others b) The table s inconsistent with the others The contour plot s inconsistent with the others
Step by Step Solution
There are 3 Steps involved in it

Get step-by-step solutions from verified subject matter experts