

Question: A function g has a constant rate of change. A portion of the graph of g is shown below. b.) What does the length of
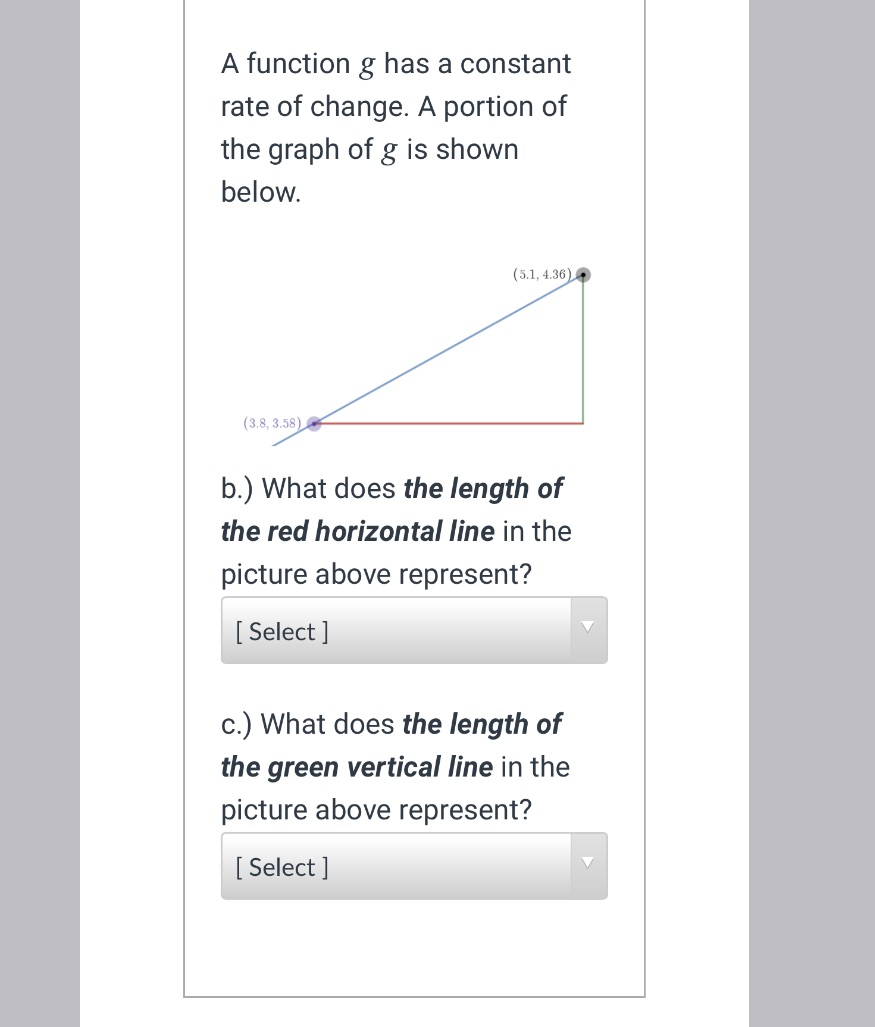

A function g has a constant rate of change. A portion of the graph of g is shown below. b.) What does the length of the red horizontal line in the picture above represent? c.) What does the length of the green vertical line in the picture above represent
Step by Step Solution
There are 3 Steps involved in it
1 Expert Approved Answer
Step: 1 Unlock

Question Has Been Solved by an Expert!
Get step-by-step solutions from verified subject matter experts
Step: 2 Unlock
Step: 3 Unlock