

Question: a. Given the data given above, develop a forecast for variable A and B using the exponential smoothing with an alpha value of 0.5 .
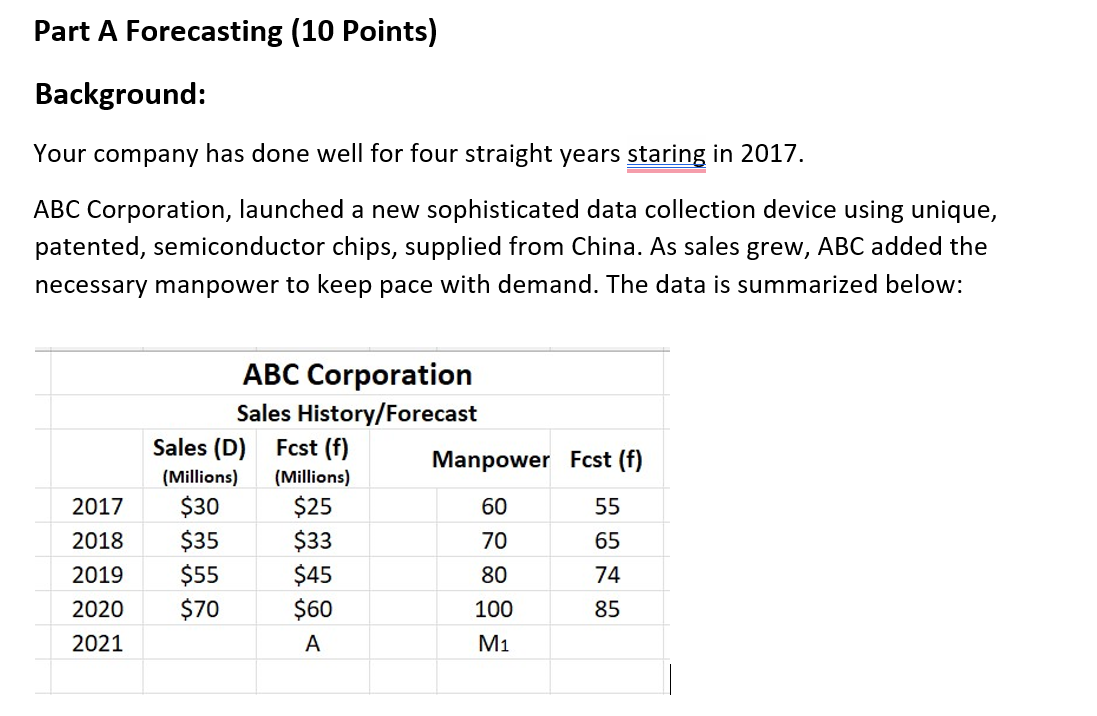
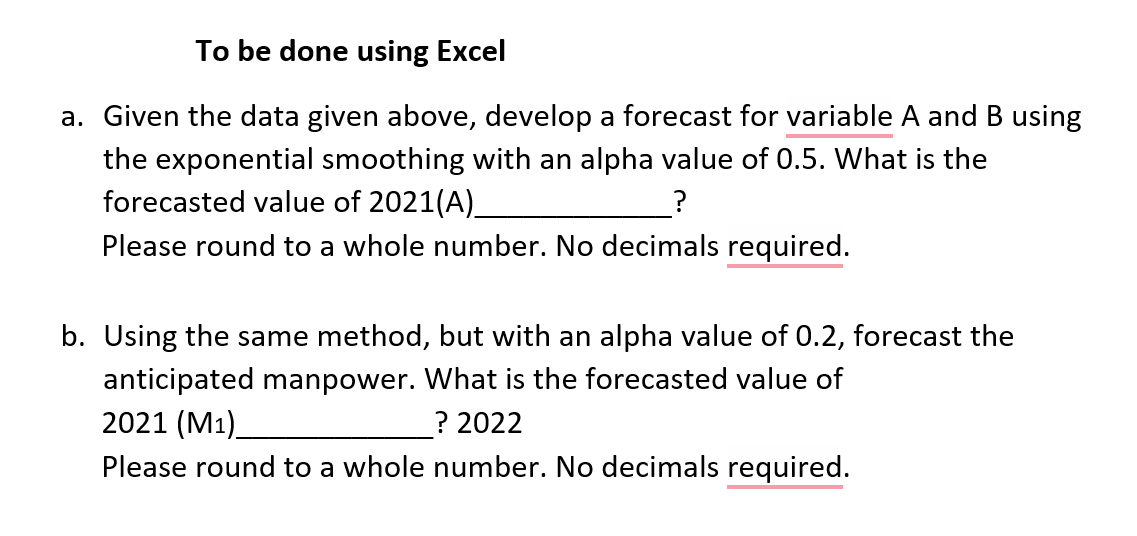
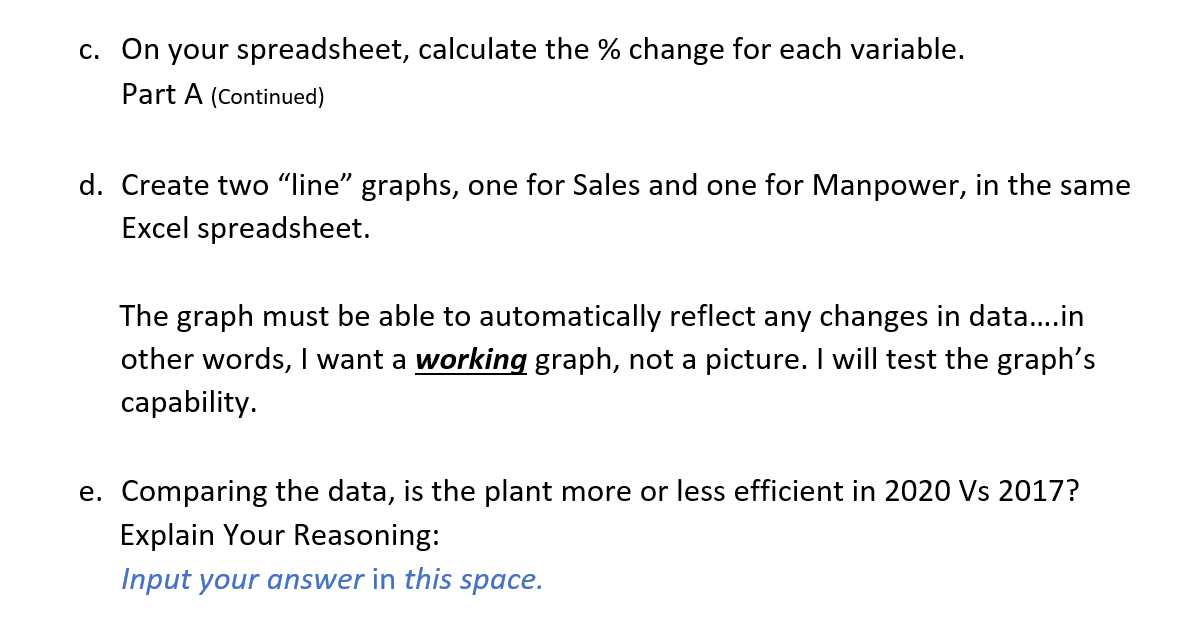
a. Given the data given above, develop a forecast for variable A and B using the exponential smoothing with an alpha value of 0.5 . What is the forecasted value of 2021(A). ? Please round to a whole number. No decimals required. b. Using the same method, but with an alpha value of 0.2 , forecast the anticipated manpower. What is the forecasted value of 2021 (M1). ? 2022 Please round to a whole number. No decimals required. Part A Forecasting (10 Points) Background: Your company has done well for four straight years staring in 2017. ABC Corporation, launched a new sophisticated data collection device using unique, patented, semiconductor chips, supplied from China. As sales grew, ABC added the necessary manpower to keep pace with demand. The data is summarized below: c. On your spreadsheet, calculate the % change for each variable. Part A (Continued) d. Create two "line" graphs, one for Sales and one for Manpower, in the same Excel spreadsheet. The graph must be able to automatically reflect any changes in data....in other words, I want a working graph, not a picture. I will test the graph's capability. e. Comparing the data, is the plant more or less efficient in 2020 Vs 2017 ? Explain Your Reasoning: Input your answer in this space
Step by Step Solution
There are 3 Steps involved in it

Get step-by-step solutions from verified subject matter experts