

Question: (a) Given the data in the table, graphically show the monopoly's profit maximization position.(b) What output and what price do you predict the monopoly will
(a) Given the data in the table, graphically show the monopoly's profit maximization position.(b) What output and what price do you predict the monopoly will choose?(c) Does the monopoly produce at the socially optimal level? Show anyinefficiency on your graph.(d) To improve market efficiency, the government is considering subsidizing themonopoly's production. How much should the subsidy be and how can this subsidy improve market efficiency?2 a.) Draw the demand, marginal revenue and marginal cost curve for a monopolist. Show the equilibrium price and quantity supplied and total profit. Show the equilibrium price and quantity supplied and total profit.b.) Suppose new policy suggest the government can imposed a tax on monopolists equal to 25 percent of their economic profits, how this affect the output level of the firm? How about the price? Explain.
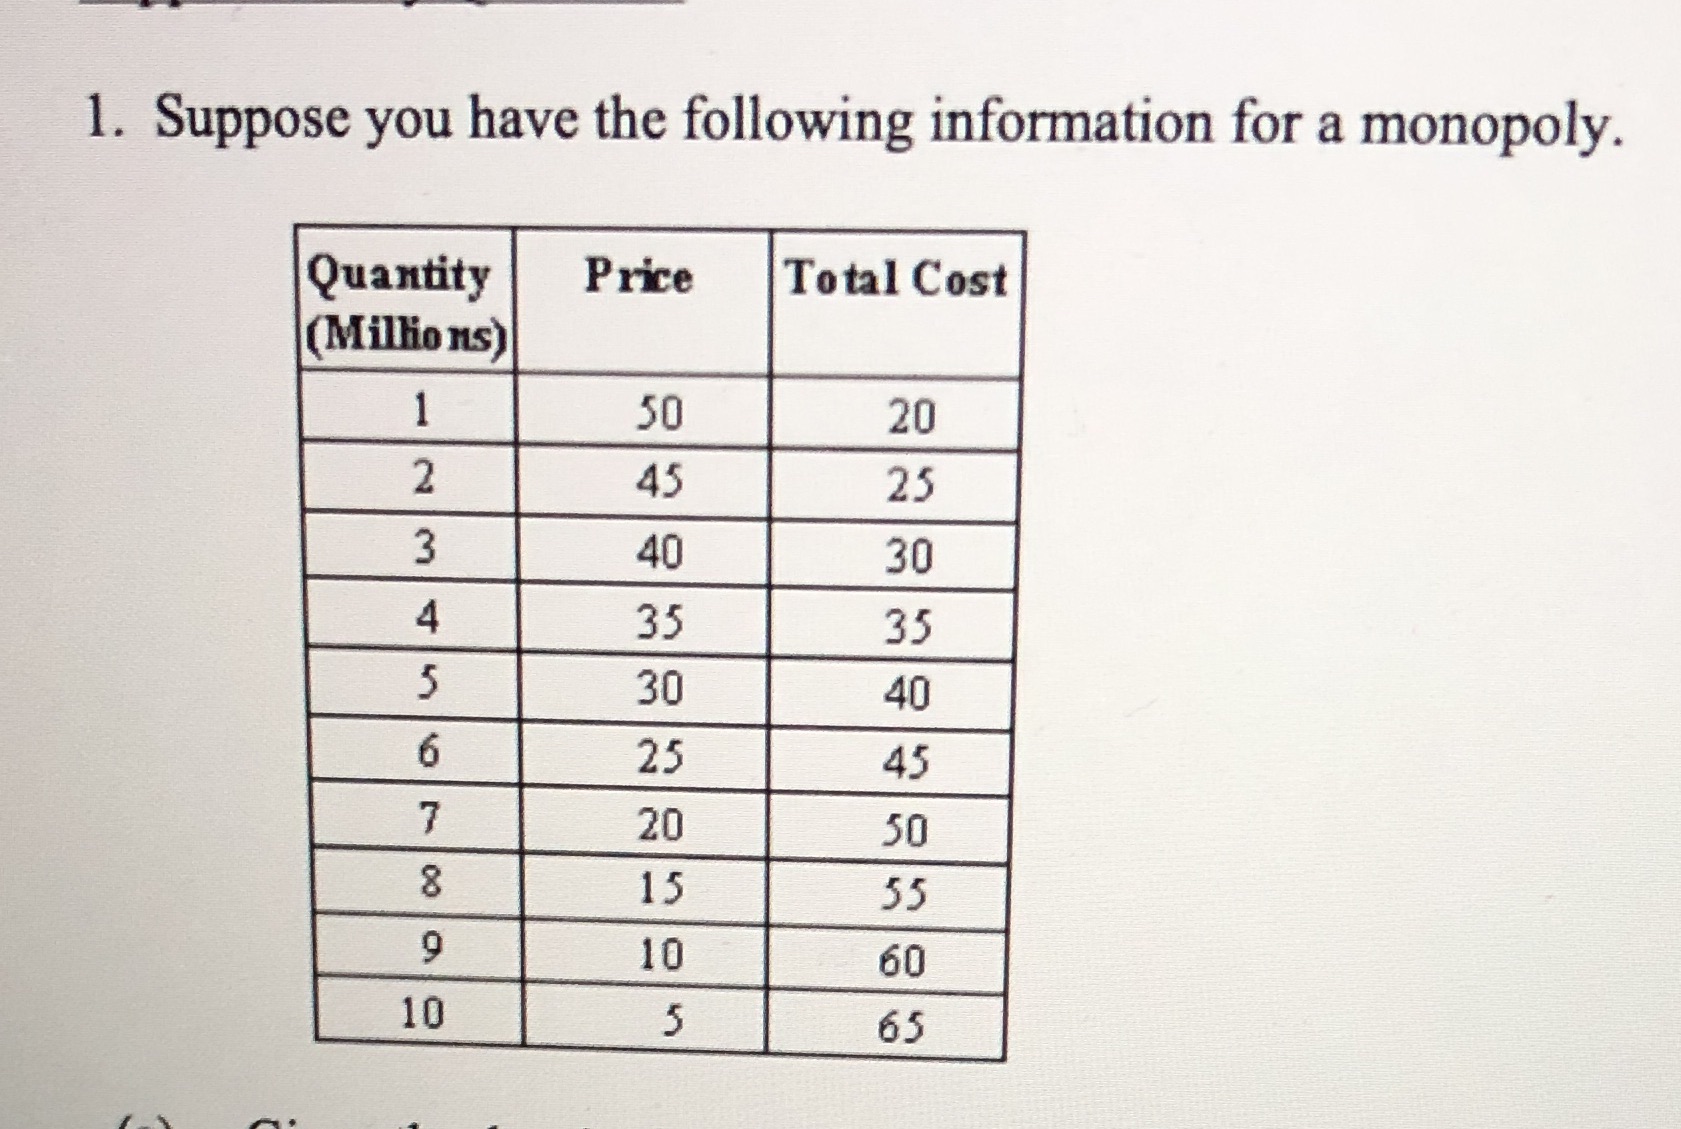
1. Suppose you have the following information for a monopoly. Quantity Price Total Cost (Millions) 50 20 2 45 25 3 40 30 4 35 35 30 40 25 45 7 20 50 8 15 55 9 10 60 10 5 65
Step by Step Solution
There are 3 Steps involved in it

Get step-by-step solutions from verified subject matter experts