

Question: a) Given the price and maturity dates, complete the table by computing days to maturity and annual yield. b) Plot the Treasury Strip Yield Curve
a) Given the price and maturity dates, complete the table by computing days to maturity and annual yield.
b) Plot the Treasury Strip Yield Curve ( Annual Yield vs maturity)
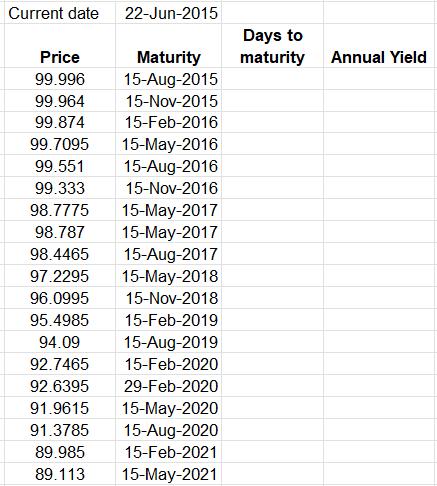
Current date 22-Jun-2015 \begin{tabular}{|c|c|c|c|} \hline Price & Maturity & Daystomaturity & Annual Yield \\ \hline 99.996 & 15-Aug-2015 & & \\ \hline 99.964 & 15-Nov-2015 & \\ \hline 99.874 & 15-Feb-2016 & \\ \hline 99.7095 & 15-May-2016 & \\ \hline 99.551 & 15-Aug-2016 \\ \hline 99.333 & 15-Nov-2016 \\ \hline 98.7775 & 15-May-2017 \\ \hline 98.787 & 15-May-2017 \\ \hline 98.4465 & 15-Aug-2017 \\ \hline 97.2295 & 15-May-2018 \\ \hline 96.0995 & 15-Nov-2018 \\ \hline 95.4985 & 15-Feb-2019 \\ \hline 94.09 & 15-Aug-2019 \\ \hline 92.7465 & 15-Feb-2020 \\ \hline 92.6395 & 29-Feb-2020 \\ \hline 91.9615 & 15-May-2020 \\ \hline 91.3785 & 15-Aug-2020 \\ \hline 89.985 & 15-Feb-2021 \\ \hline 89.113 & 15-May-2021 \\ \hline \end{tabular}
Step by Step Solution
There are 3 Steps involved in it

Get step-by-step solutions from verified subject matter experts