

Question: a. Graph a scatterplot and add the trendline. b. State the equation of the trendline c. Using Pearson's Correlation Coefficient, discuss the strength of the
a. Graph a scatterplot and add the trendline.
b. State the equation of the trendline
c. Using Pearson's Correlation Coefficient, discuss the strength of the relationship between pages and price.
d. What type of relationship, if any, is there between year and GDP?
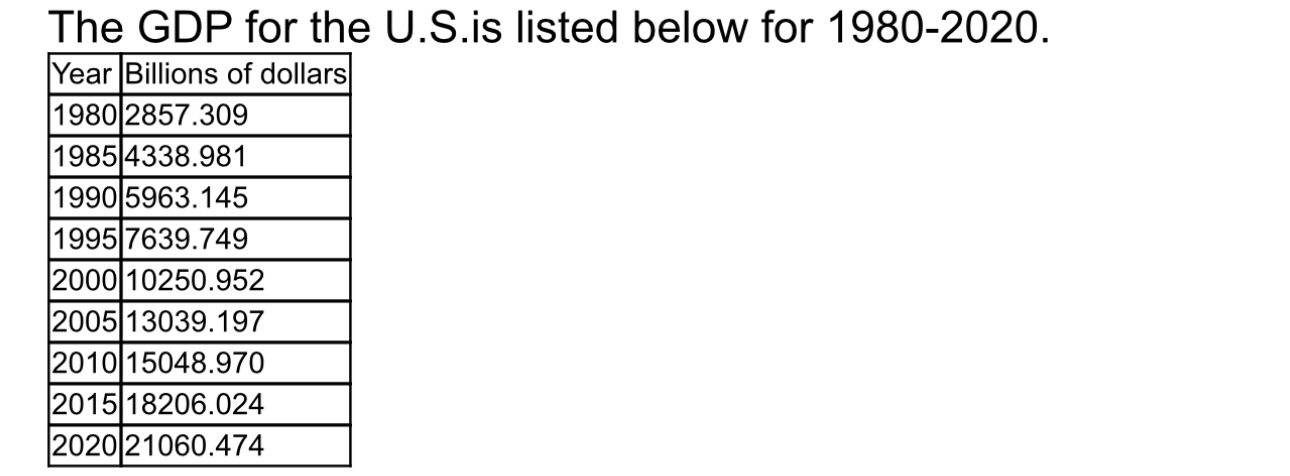
The GDP for the U.S.is listed below for 1980-2020. Year Billions of dollars 1980 2857.309 1985 4338.981 1990 5963.145 1995 7639.749 2000 10250.952 2005 13039. 197 2010 15048.970 2015 18206.024 2020 21060.474
Step by Step Solution
There are 3 Steps involved in it
1 Expert Approved Answer
Step: 1 Unlock

Question Has Been Solved by an Expert!
Get step-by-step solutions from verified subject matter experts
Step: 2 Unlock
Step: 3 Unlock