

Question: A. Graph and explain the yield curve. Explain how and why it might be upward sloping and when it might be downward sloping. Explain. b.
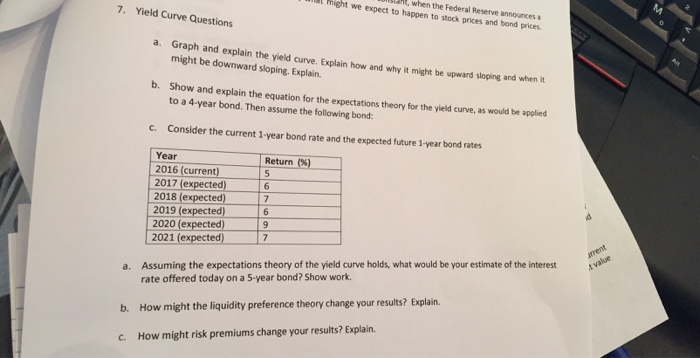
A. Graph and explain the yield curve. Explain how and why it might be upward sloping and when it might be downward sloping. Explain. b. Show and explain the equation for the expectations theory for the yield curve, as would be applied to a 4-year bond. Then assume the following bond: c. Consider the current 1-year bond rate and the expected future 1-year bond rates a. Assuming the expectations theory of the yield curve holds, what would be your estimate of the interest rate offered today on a 5-year bond? Show work. b. How might the liquidity preference theory change your results? Explain. c. How might risk premiums change your results? Explain
Step by Step Solution
There are 3 Steps involved in it

Get step-by-step solutions from verified subject matter experts