

Question: A graph can be used to display collected data. Suppose the following temperatures are listed for the upcoming 1 0 days in Philadelphia: table
A graph can be used to display collected data.
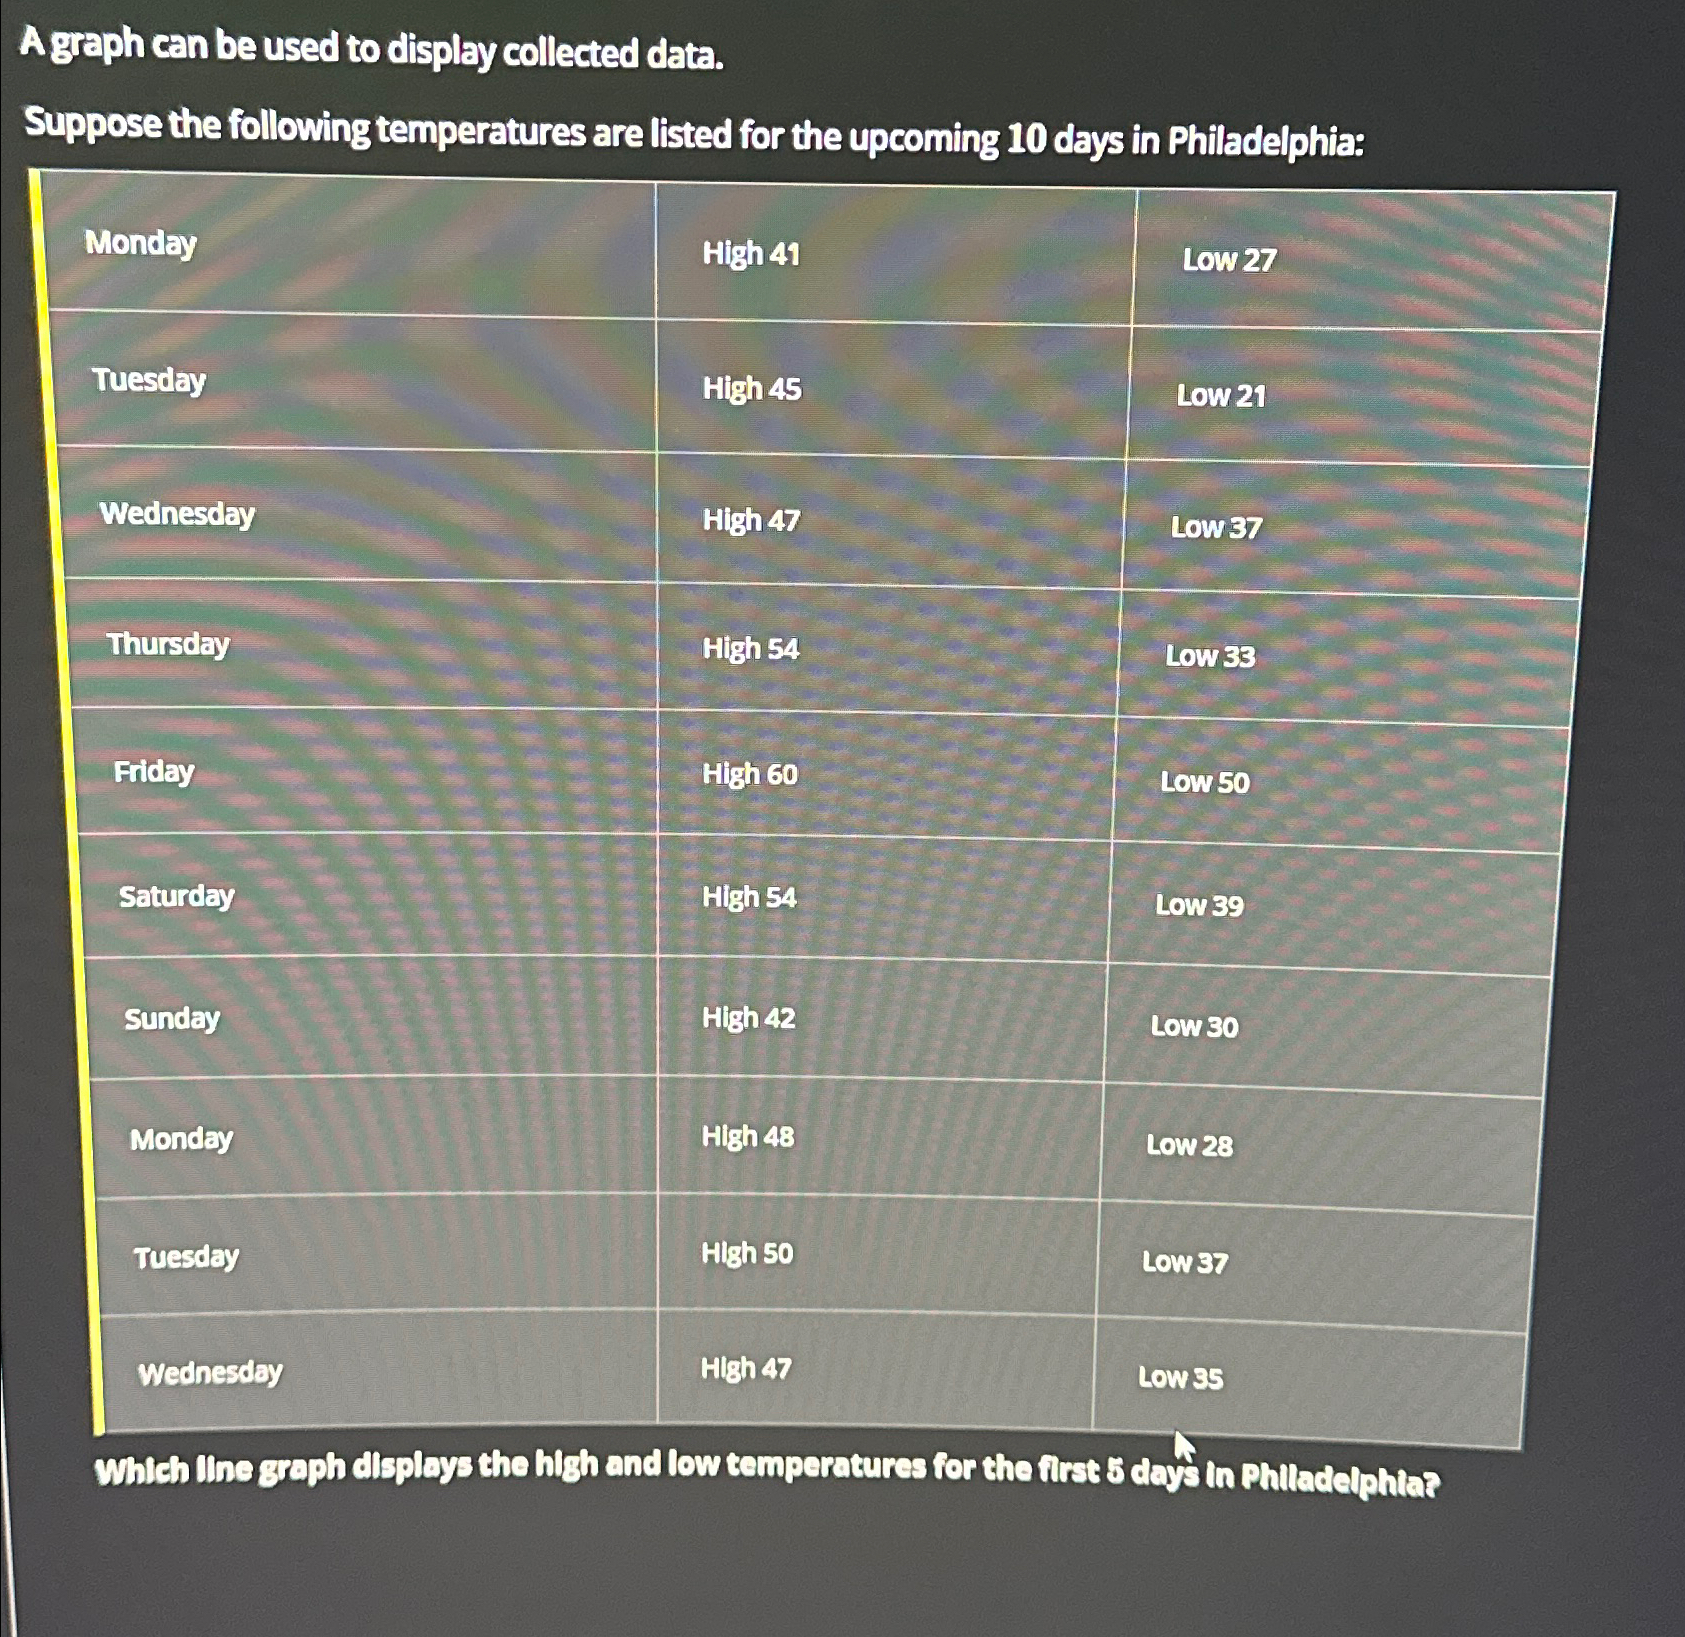
Suppose the following temperatures are listed for the upcoming days in Philadelphia:
tableMondayHigh Low TuesdayHigh Low WednesdayHigh Low ThursdayHigh Low FildayHigh LOW SaturdayHigh Low SundayHigh LOw MondayHigh Low TuesdayHigh Low WednesdayHIgh Low
Which llne graph displays the high and low temperatures for the first day in Philadelphtar
Step by Step Solution
There are 3 Steps involved in it
1 Expert Approved Answer
Step: 1 Unlock

Question Has Been Solved by an Expert!
Get step-by-step solutions from verified subject matter experts
Step: 2 Unlock
Step: 3 Unlock