

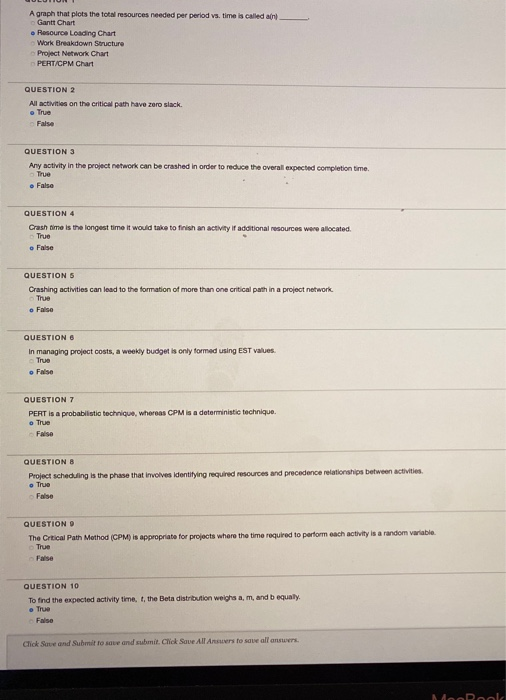
Question: A graph that plots the total resources needed per period vs. time is called ain) Gantt Chart Resource Loading Chart Work Breakdown Structure Project Network
Step by Step Solution
There are 3 Steps involved in it
1 Expert Approved Answer
Step: 1 Unlock

Question Has Been Solved by an Expert!
Get step-by-step solutions from verified subject matter experts
Step: 2 Unlock
Step: 3 Unlock