

Question: A graphical model can be used to predict stock values for a new stock. A brand new stock is also called an initial public offering,
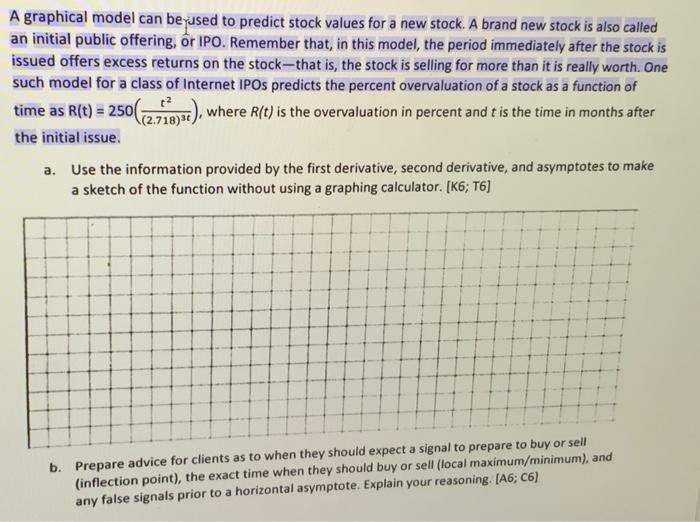
A graphical model can be used to predict stock values for a new stock. A brand new stock is also called an initial public offering, or IPO. Remember that, in this model, the period immediately after the stock is issued offers excess returns on the stock-that is, the stock is selling for more than it is really worth. One such model for a class of Internet IPOs predicts the percent overvaluation of a stock as a function of time as R(t)=250((2.718)3tt2), where R(t) is the overvaluation in percent and t is the time in months after the initial issue. a. Use the information provided by the first derivative, second derivative, and asymptotes to make a sketch of the function without using a graphing calculator. [K6; T6] b. Prepare advice for clients as to when they should expect a signal to prepare to buy or sell (inflection point), the exact time when they should buy or sell (local maximum/minimum), and any false signals prior to a horizontal asymptote. Explain your reasoning. [A6; C6 ] A graphical model can be used to predict stock values for a new stock. A brand new stock is also called an initial public offering, or IPO. Remember that, in this model, the period immediately after the stock is issued offers excess returns on the stock-that is, the stock is selling for more than it is really worth. One such model for a class of Internet IPOs predicts the percent overvaluation of a stock as a function of time as R(t)=250((2.718)3tt2), where R(t) is the overvaluation in percent and t is the time in months after the initial issue. a. Use the information provided by the first derivative, second derivative, and asymptotes to make a sketch of the function without using a graphing calculator. [K6; T6] b. Prepare advice for clients as to when they should expect a signal to prepare to buy or sell (inflection point), the exact time when they should buy or sell (local maximum/minimum), and any false signals prior to a horizontal asymptote. Explain your reasoning. [A6; C6 ]
Step by Step Solution
There are 3 Steps involved in it

Get step-by-step solutions from verified subject matter experts