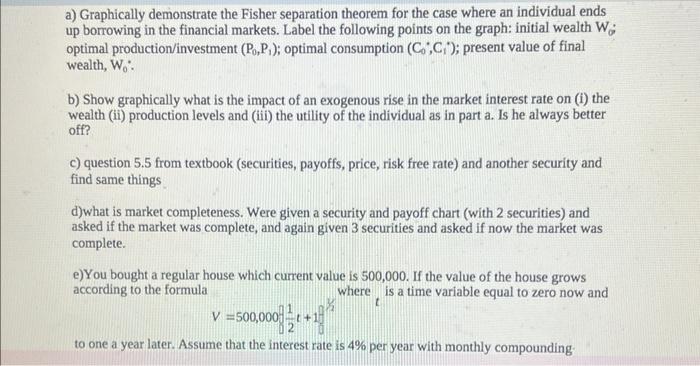
Question: a) Graphically demonstrate the Fisher separation theorem for the case where an individual ends up borrowing in the financial markets. Label the following points on

a) Graphically demonstrate the Fisher separation
a) Graphically demonstrate the Fisher separation theorem for the case where an individual ends up borrowing in the financial markets. Label the following points on the graph: initial wealth W optimal production/investment (P0,P1); optimal consumption (C0,C1); present value of final wealth, W0: : b) Show graphically what is the impact of an exogenous rise in the market interest rate on (i) the wealth (ii) production levels and (iii) the utility of the individual as in part a. Is he always better off? c) question 5.5 from textbook (securities, payoffs, price, risk free rate) and another security and find same things d) what is market completeness. Were given a security and payoff chart (with 2 securities) and asked if the market was complete, and again given 3 securities and asked if now the market was complete. e) You bought a regular house which current value is 500,000 . If the value of the house grows according to the formula where is a time variable equal to zero now and V=500,00021t+1]2 to one a year later. Assume that the interest rate is 4% per year with monthly compounding

Step by Step Solution

There are 3 Steps involved in it

1 Expert Approved Answer
Step: 1 Unlock blur-text-image
Question Has Been Solved by an Expert!

Get step-by-step solutions from verified subject matter experts

Step: 2 Unlock
Step: 3 Unlock

Students Have Also Explored These Related General Management Questions!