

Question: A grinding and deburring operation is monitored using a mean and a range chart. Six samples of 20 observations have been obtained, and the sample
A grinding and deburring operation is monitored using a mean and a range chart. Six samples of 20 observations have been obtained, and the sample means and ranges computed: 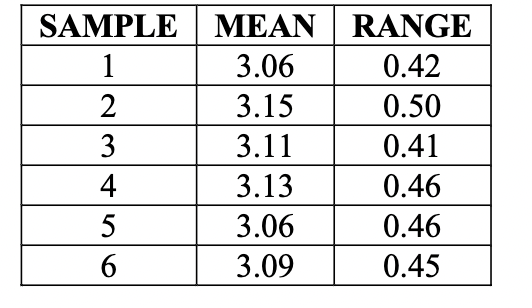 a) Determine upper and lower control limits for the mean and range charts assuming 3-s control limits. b) Is the process in control? c) What value of z would give an alpha risk of 3% for the process?
\begin{tabular}{|c|c|c|} \hline SAMPLE & MEAN & RANGE \\ \hline 1 & 3.06 & 0.42 \\ \hline 2 & 3.15 & 0.50 \\ \hline 3 & 3.11 & 0.41 \\ \hline 4 & 3.13 & 0.46 \\ \hline 5 & 3.06 & 0.46 \\ \hline 6 & 3.09 & 0.45 \\ \hline \end{tabular}
Step by Step Solution
There are 3 Steps involved in it
1 Expert Approved Answer
Step: 1 Unlock

Question Has Been Solved by an Expert!
Get step-by-step solutions from verified subject matter experts
Step: 2 Unlock
Step: 3 Unlock