

Question: A high school biology class conducted genetics experiments with randomly selected fruit ies, and the results in the following table are based on the results
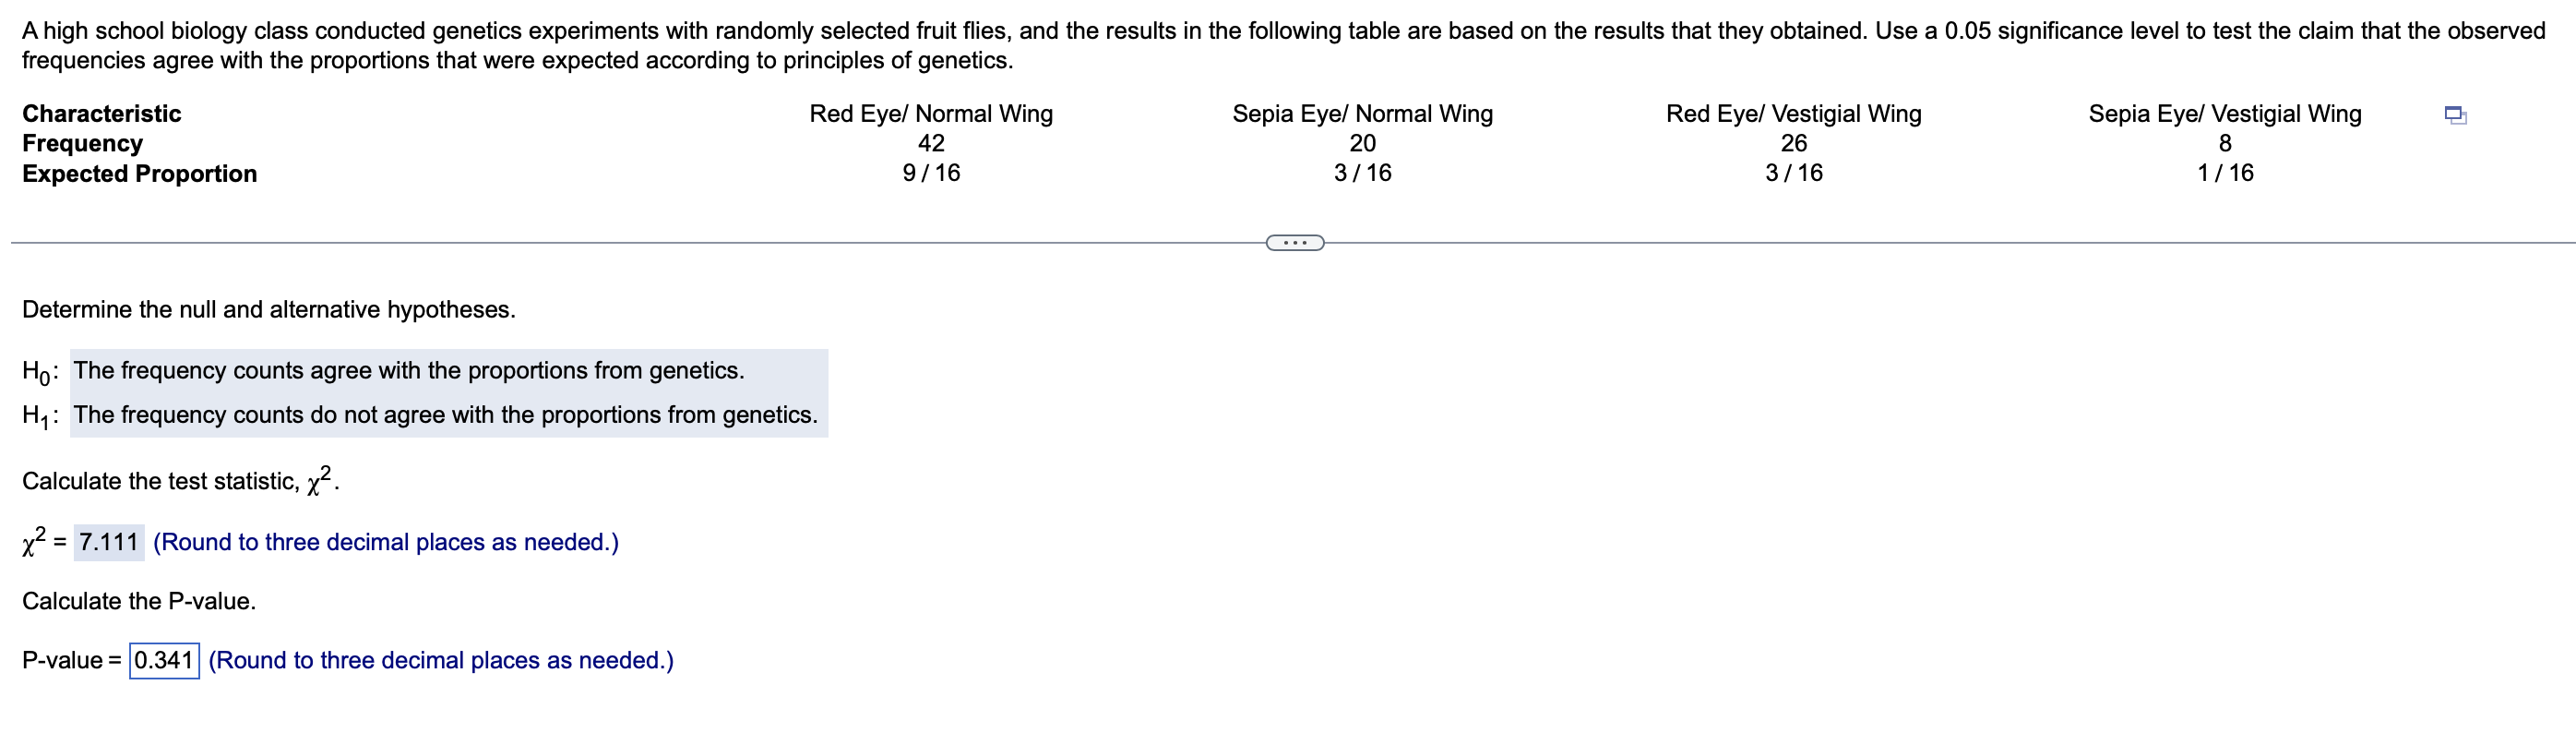

A high school biology class conducted genetics experiments with randomly selected fruit ies, and the results in the following table are based on the results that they obtained. Use a 0.05 significance level to test the claim that the observed frequencies agree with the proportions that were expected according to principles of genetics. Characteristic Red Eye/ Normal Wing Sepia Eye/ Normal Wing Red Eye/ Vestigial Wing Sepia Eye/ Vestigial Wing :21 Frequency 42 20 26 8 Expected Proportion 9/16 3/16 3/16 1/16 Determine the null and alternative hypotheses. H0: The frequency oounts agree with the proportions from genetics. H1 : The frequency counts do not agree with the proportions from genetics. Calculate the test statistic, X2- x2 = 1.111 (Round to three decimal places as needed.) Calculate the P-value. P-value = 0.341 (Round to three decimal places as needed.)
Step by Step Solution
There are 3 Steps involved in it

Get step-by-step solutions from verified subject matter experts