

Question: A Homework Week 6 (ADA) - MATH X + C A webassign.net/web/Student/Assignment-Responses/submit?dep=23562848&tags=autosave#question4261088_5 G 6. [1.04/8.33 Points] DETAILS PREVIOUS ANSWERS BBBASICSTATSACC 8.2.022. MY NOTES ASK YOUR
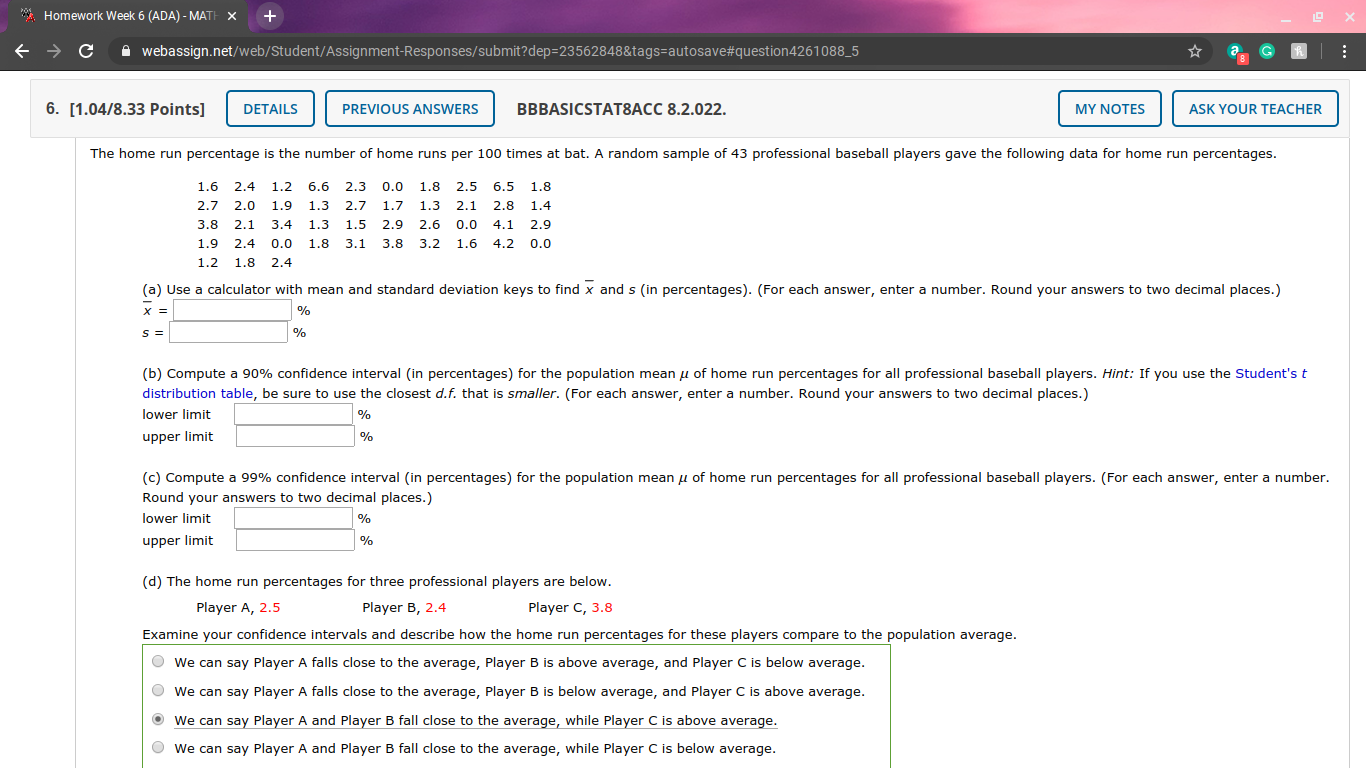
"A Homework Week 6 (ADA) - MATH X + C A webassign.net/web/Student/Assignment-Responses/submit?dep=23562848&tags=autosave#question4261088_5 G 6. [1.04/8.33 Points] DETAILS PREVIOUS ANSWERS BBBASICSTATSACC 8.2.022. MY NOTES ASK YOUR TEACHER The home run percentage is the number of home runs per 100 times at bat. A random sample of 43 professional baseball players gave the following data for home run percentages. 1.6 2.4 4 1.2 6.6 2.3 0.0 1.8 2.5 6.5 1.8 72.0 1.9 1.3 2.7 1.7 1.3 2.1 2.8 1.4 3.8 2.1 3.4 1.3 1.5 2.9 2.6 0.0 4.1 1.9 2.4 0.0 1.8 3.1 3.8 3.2 1.6 4.2 0.0 1.2 1.8 2.4 (a) Use a calculator with mean and standard deviation keys to find x and s (in percentages). (For each answer, enter a number. Round your answers to two decimal places.) X = % S = % (b) Compute a 90% confidence interval (in percentages) for the population mean / of home run percentages for all professional baseball players. Hint: If you use the Student's t distribution table, be sure to use the closest d.f. that is smaller. (For each answer, enter a number. Round your answers to two decimal places.) lower limit % upper limit % (c) Compute a 99% confidence interval (in percentages) for the population mean / of home run percentages for all professional baseball players. (For each answer, enter a number. Round your answers to two decimal places.) lower limit % upper limit % (d) The home run percentages for three professional players are below. Player A, 2.5 Player B, 2.4 Player C, 3.8 Examine your confidence intervals and describe how the home run percentages for these players compare to the population average. We can say Player A falls close to the average, Player B is above average, and Player C is below average. We can say Player A falls close to the average, Player B is below average, and Player C is above average. We can say Player A and Player B fall close to the average, while Player C is above average. We can say Player A and Player B fall close to the average, while Player C is below average
Step by Step Solution
There are 3 Steps involved in it

Get step-by-step solutions from verified subject matter experts