

Question: a horizontal analysis using excel x & for . A D E F B Rosey's Roses Income Statement for the period ended 12/31/2022 $ 200,000
a horizontal analysis using excel 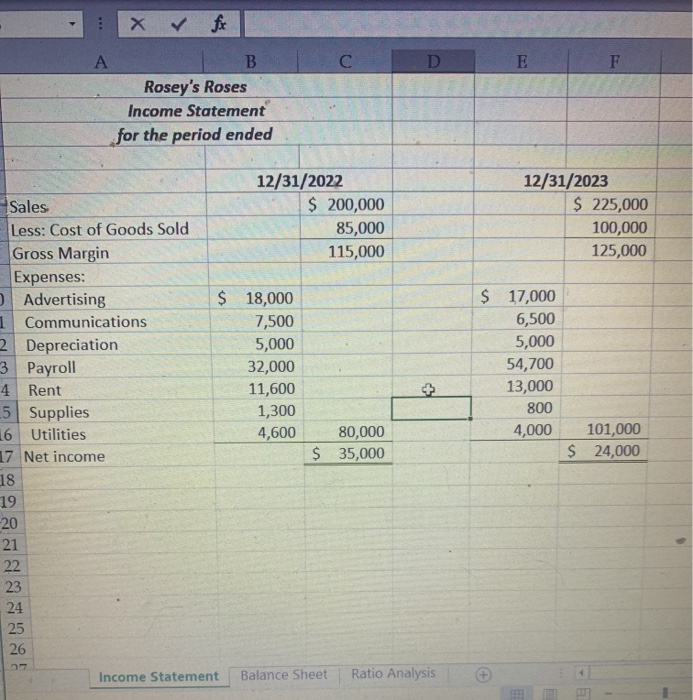
x & for . A D E F B Rosey's Roses Income Statement for the period ended 12/31/2022 $ 200,000 85,000 115,000 12/31/2023 $ 225,000 100,000 125,000 Sales Less: Cost of Goods Sold Gross Margin Expenses: Advertising 1 Communications 2 Depreciation 3 Payroll 4 Rent 5 Supplies 16 Utilities 17 Net income 18 19 -20 21 22 23 $ 18,000 7,500 5,000 32,000 11,600 1,300 4,600 $ 17,000 6,500 5,000 54,700 13,000 800 4,000 80,000 $ 35,000 101,000 $ 24,000 24 25 26 Income Statement Balance Sheet Ratio Analysis
Step by Step Solution
There are 3 Steps involved in it
1 Expert Approved Answer
Step: 1 Unlock

Question Has Been Solved by an Expert!
Get step-by-step solutions from verified subject matter experts
Step: 2 Unlock
Step: 3 Unlock