Question: A hospital would like to develop a regression model to predict the total hospital bill for a patient based on his or her length of
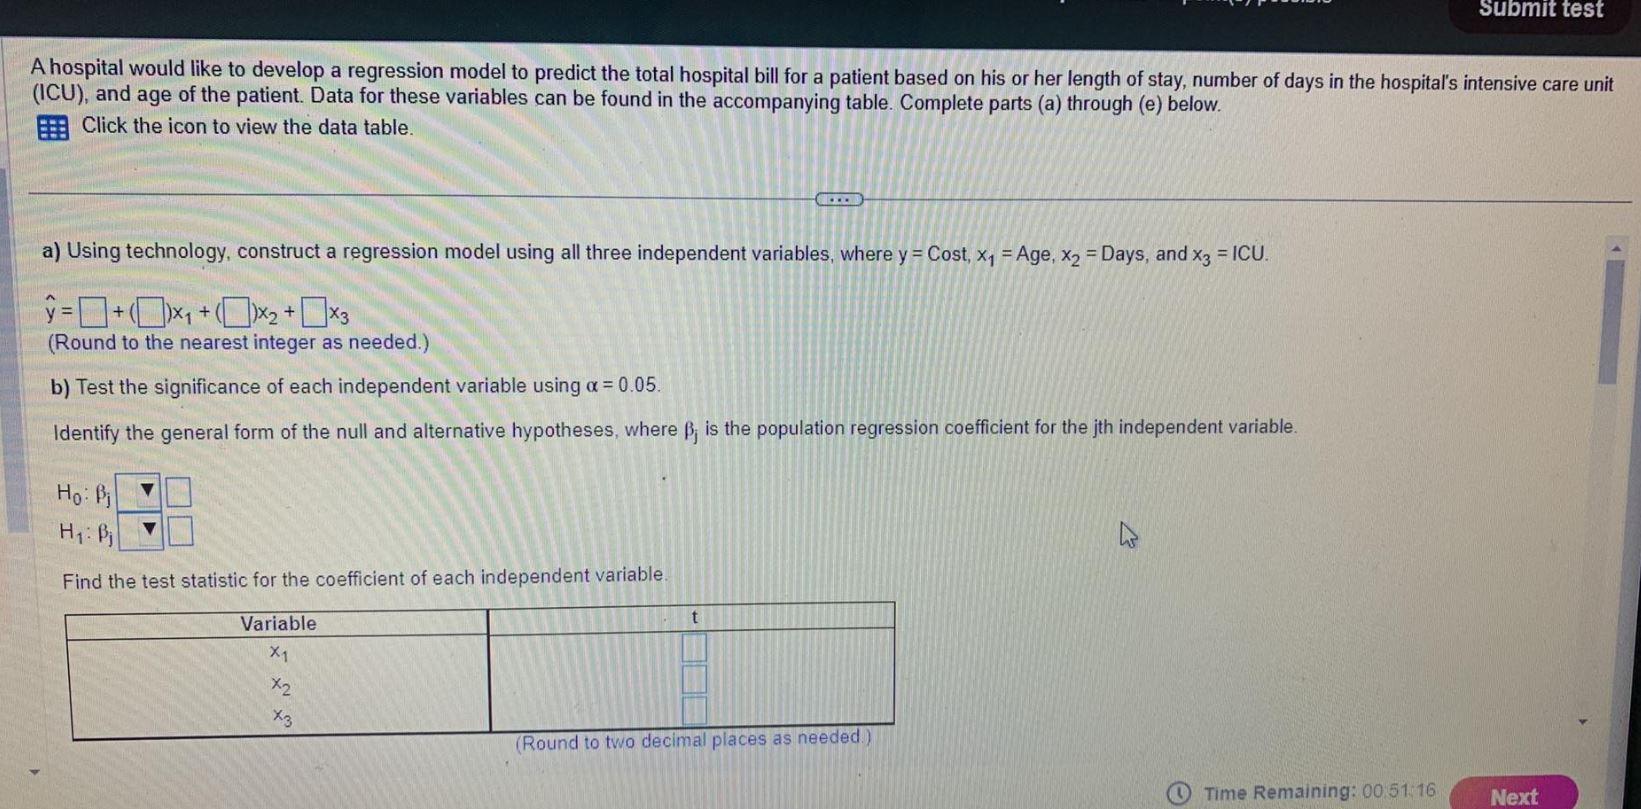
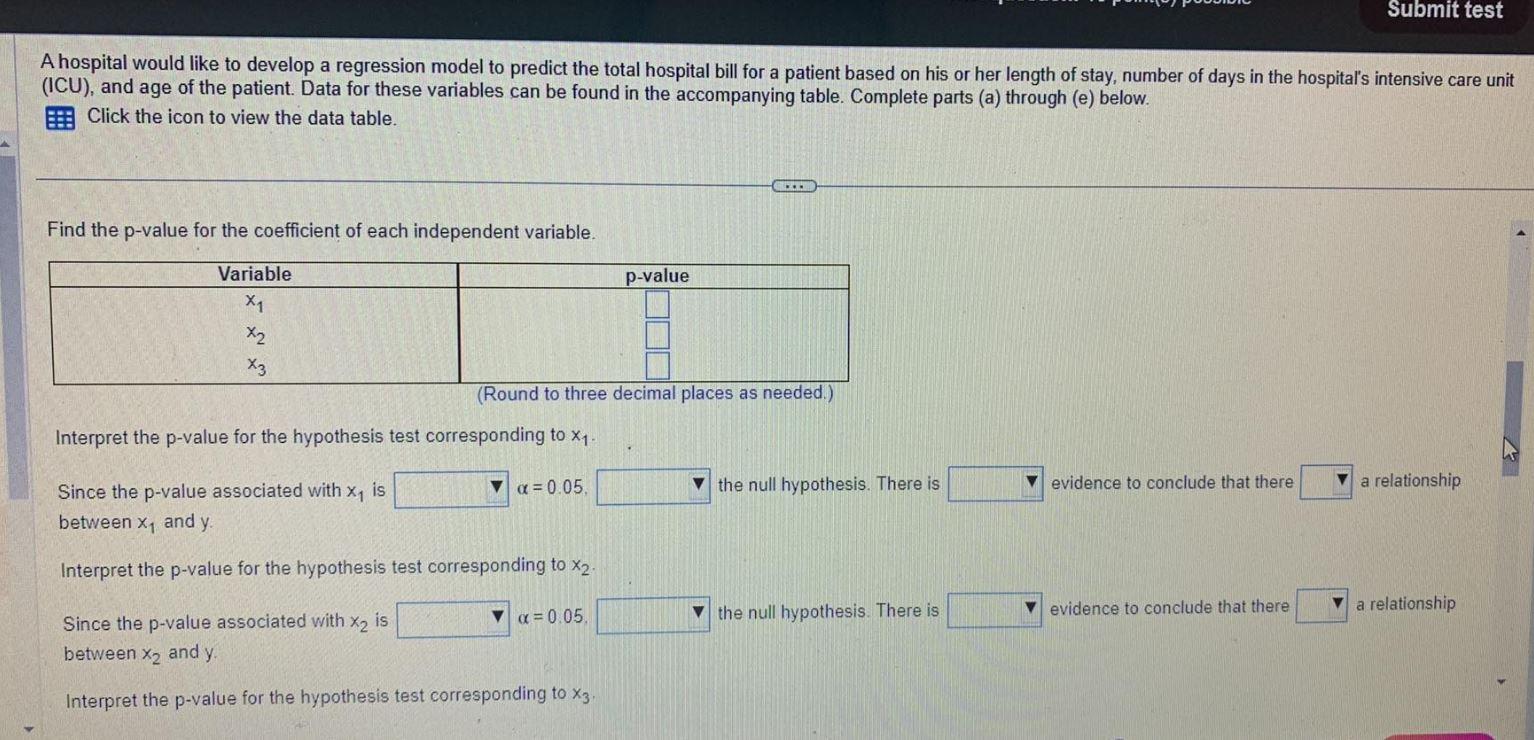
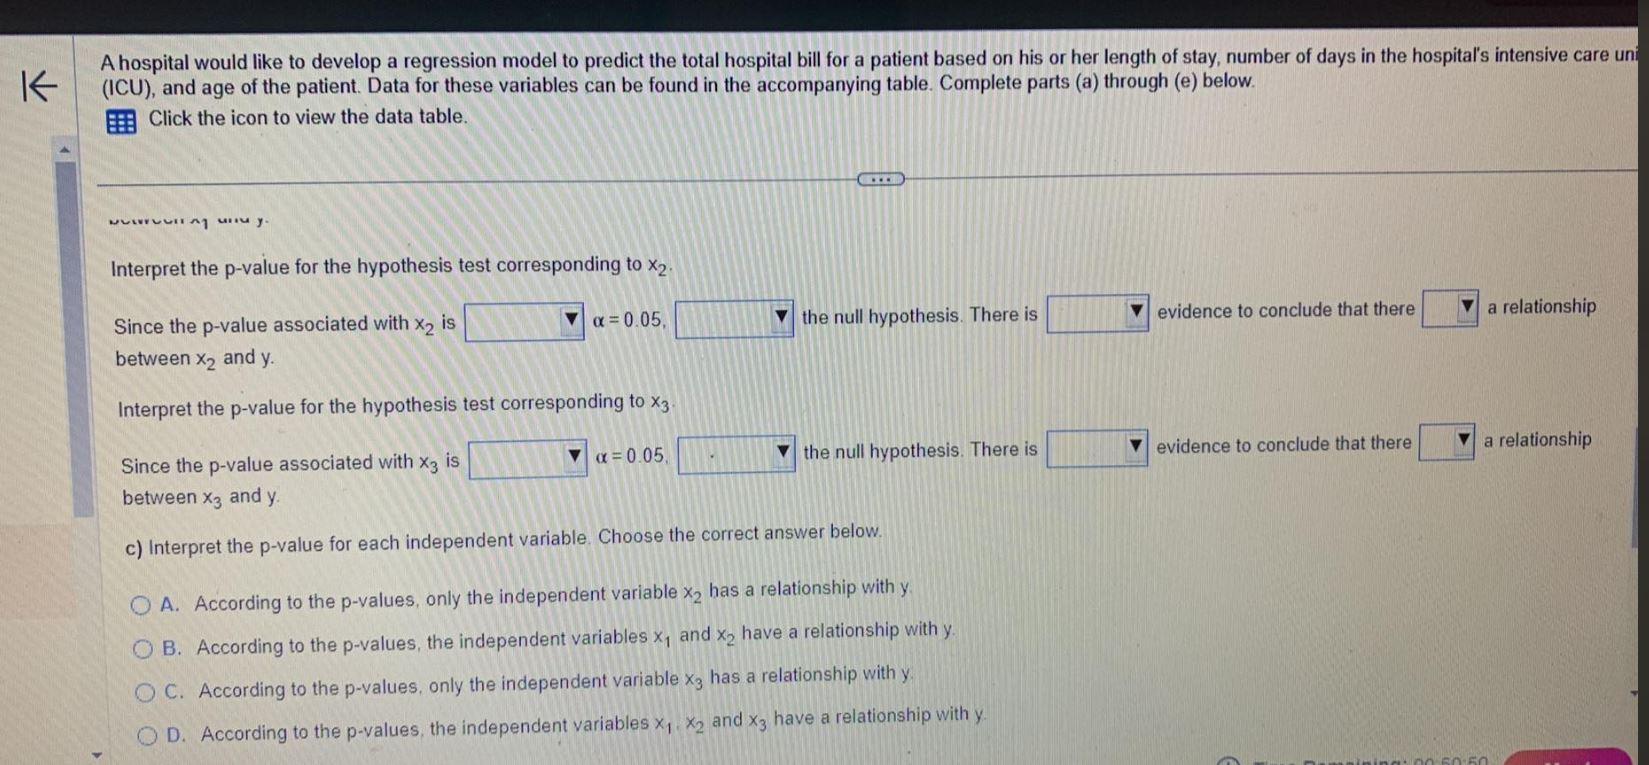
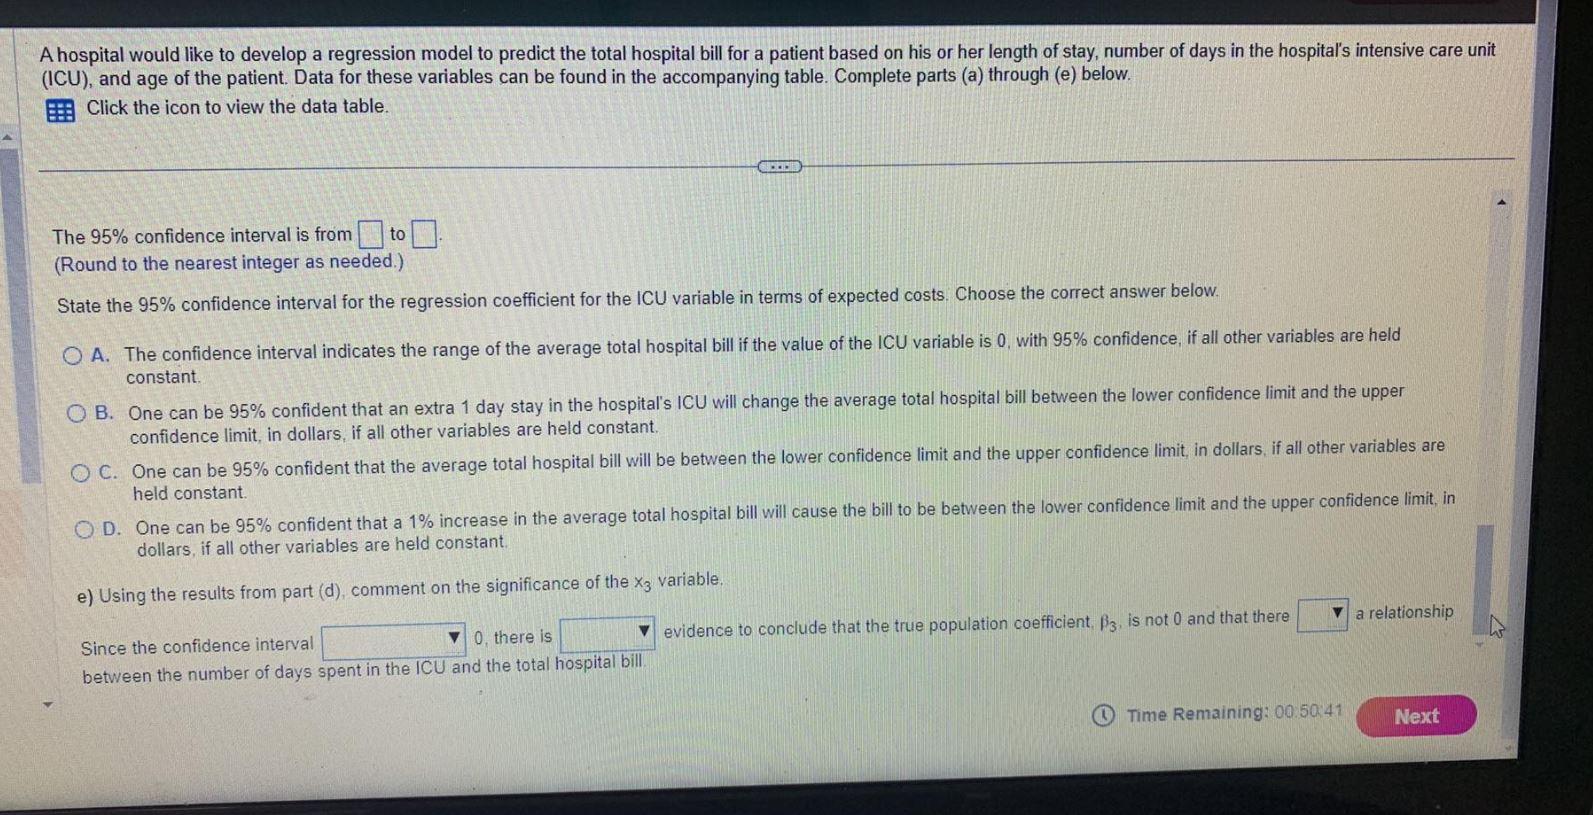
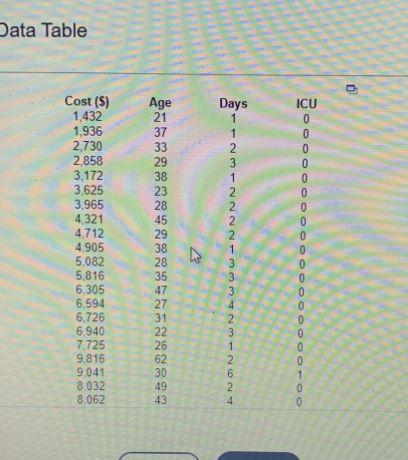
A hospital would like to develop a regression model to predict the total hospital bill for a patient based on his or her length of stay, number of days in the hospital's intensive care unit (ICU), and age of the patient. Data for these variables can be found in the accompanying table. Complete parts (a) through (e) below. Click the icon to view the data table. a) Using technology, construct a regression model using all three independent variables, where y= Cost, x1=Age,x2= Days, and x3=ICU. y^=+1x1+(x2+x3 (Round to the nearest integer as needed.) b) Test the significance of each independent variable using =0.05. A hospital would like to develop a regression model to predict the total hospital bill for a patient based on his or her length of stay, number of days in the hospital's intensive care unit (ICU), and age of the patient. Data for these variables can be found in the accompanying table. Complete parts (a) through (e) below. Click the icon to view the data table. Find the p-value for the coefficient of each independent variable. Interpret the p-value for the hypothesis test corresponding to x1. Since the p-value associated with x1 is =0.05, the null hypothesis. There is evidence to conclude that there a relationship between x1 and y. Interpret the p-value for the hypothesis test corresponding to x2. Since the p-value associated with x2 is =0.05 the null hypothesis. There is evidence to conclude that there a relationship between x2 and y. Interpret the p-value for the hypothesis test corresponding to x3. A hospital would like to develop a regression model to predict the total hospital bill for a patient based on his or her length of stay, number of days in the hospital's intensive care u (ICU), and age of the patient. Data for these variables can be found in the accompanying table. Complete parts (a) through (e) below. Click the icon to view the data table. Interpret the p-value for the hypothesis test corresponding to x2. Since the p-value associated with x2 is =0.05, the null hypothesis. There is evidence to conclude that there a relationship between x2 and y. Interpret the p-value for the hypothesis test corresponding to x3. Since the p-value associated with x3 is the null hypothesis. There is evidence to conclude that there a relationship between x3 and y. c) Interpret the p-value for each independent variable. Choose the correct answer below. A. According to the p-values, only the independent variable x2 has a relationship with y. B. According to the p-values, the independent variables x1 and x2 have a relationship with y. C. According to the p-values, only the independent variable x3 has a relationship with y. D. According to the p-values, the independent variables x1,x2 and x3 have a relationship with y. A hospital would like to develop a regression model to predict the total hospital bill for a patient based on his or her length of stay, number of days in the hospital's intensive care unit (ICU), and age of the patient. Data for these variables can be found in the accompanying table. Complete parts (a) through (e) below. Click the icon to view the data table. The 95% confidence interval is from to (Round to the nearest integer as needed.) State the 95% confidence interval for the regression coefficient for the ICU variable in terms of expected costs. Choose the correct answer below. A. The confidence interval indicates the range of the average total hospital bill if the value of the ICU variable is 0 , with 95% confidence, if all other variables are held constant. B. One can be 95% confident that an extra 1 day stay in the hospital's ICU will change the average total hospital bill between the lower confidence limit and the upper confidence limit, in dollars, if all other variables are held constant. C. One can be 95% confident that the average total hospital bill will be between the lower confidence limit and the upper confidence limit, in dollars, if all other variables are held constant. D. One can be 95% confident that a 1% increase in the average total hospital bill will cause the bill to be between the lower confidence limit and the upper confidence limit, in dollars, if all other variables are held constant. e) Using the results from part (d), comment on the significance of the x3 variable. Since the confidence interval evidence to conclude that the true population coefficient, 3, is not 0 and that there a relationship between the number of days spent in the ICU and the total hospital bill. (1) Time Remaining: 00:50:41 Data Table


