

Question: a How will we determine if there is a difference between the control and cancerous condition? t): E m n Mean :3 Cells Dividing a
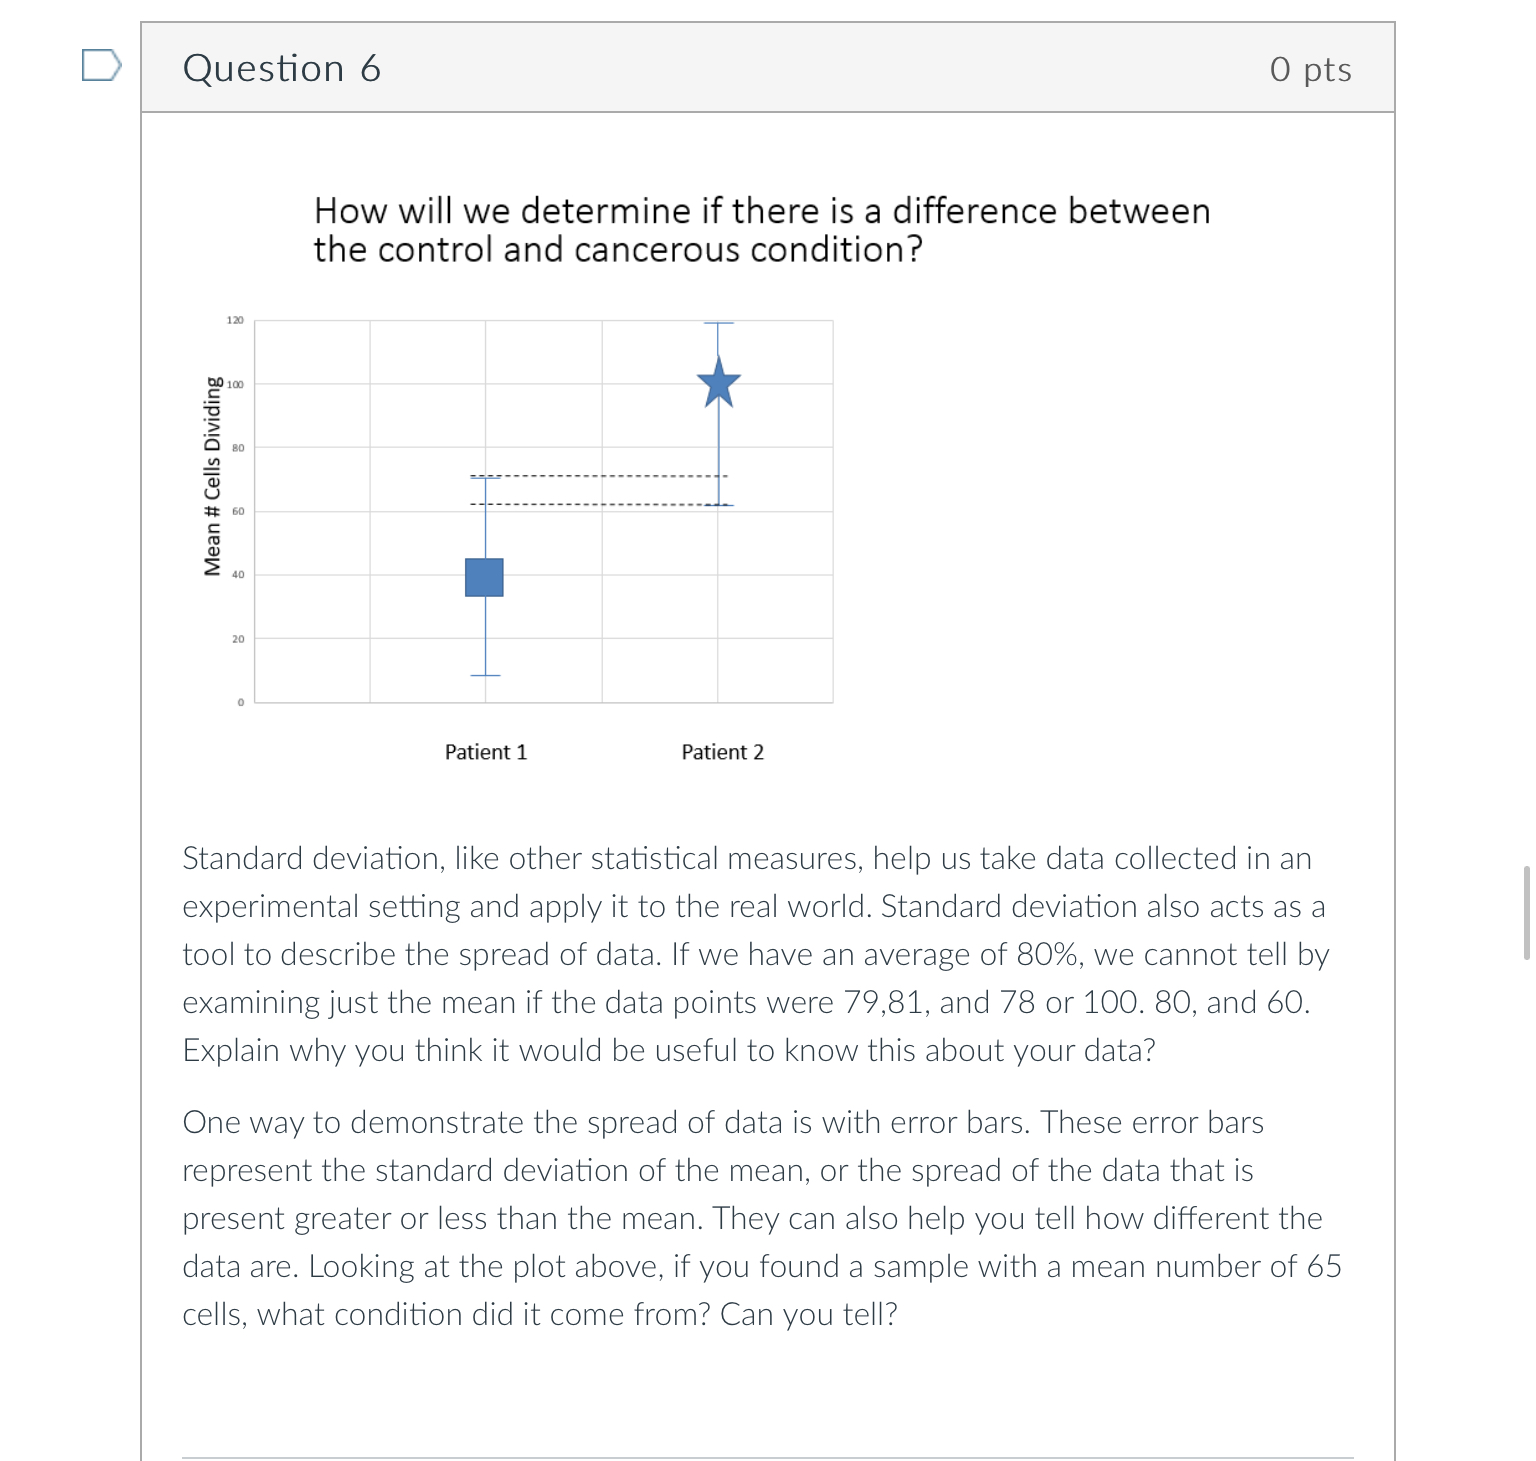
a How will we determine if there is a difference between the control and cancerous condition? t): E m n Mean :3 Cells Dividing a EU Patient 1 Patient 2 Standard deviation, like other stastical measures, help us take data collected in an experimental setting and apply it to the real world. Standard deviation also acts as a tool to describe the spread of data. If we have an average of 80%, we cannot tell by examining just the mean if the data points were 79,81, and 78 or 100. 80, and 60. Explain why you think it would be useful to know this about your data? One way to demonstrate the spread of data is with error bars. These error bars represent the standard deviation of the mean, or the spread of the data that is present greater or less than the mean. They can also help you tell how different the data are. Looking at the plot above, if you found a sample with a mean number of 65 cells, what condition did it come from? Can you tell
Step by Step Solution
There are 3 Steps involved in it

Get step-by-step solutions from verified subject matter experts