Question: A human resource manager at Beta Technologies, Inc. is interested in developing profiles of the Beta full-time employees based on the given representative sample of
A human resource manager at Beta Technologies, Inc. is interested in developing profiles of the Beta full-time employees based on the given representative sample of 52 of the companys fulltime workers in the cases accompanying Excel data file. In particular, she is interested in determining the average age, number of years of relevant full-time work experience prior to coming to Beta, number of years of full-time work experience at Beta, number of years of post secondary education, and annual salaries for those employees. Besides, she would like to analyze these characteristics separately for male and female employees. She is also interested in understanding the relationships between the employees salaries and other characteristics.
a) Create descriptive statistics data for the following variables: Age, Prior_Experience, Beta_Experience, Education, and Annual_Salary. Explain the Beta Technologies average full-time employee profile.
b) Develop a scatterplot for Beta_Experience and Annual_Salary variables. Explain what possible relationships exist between these two variables.
c) Create a histogram for Annual_Salary frequencies, and explain those salary frequencies.
d) Identify the correlation coefficients matrix using all data variables, and explain the association (strength of correlation) between salaries and all other employees characteristics.
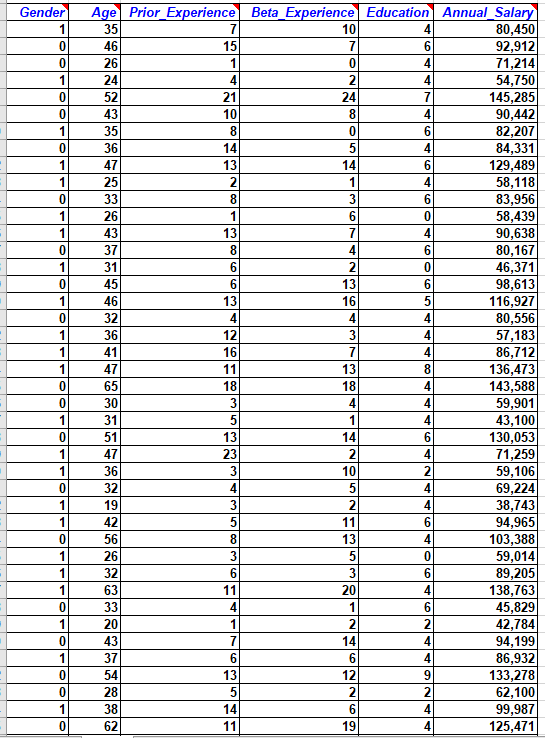
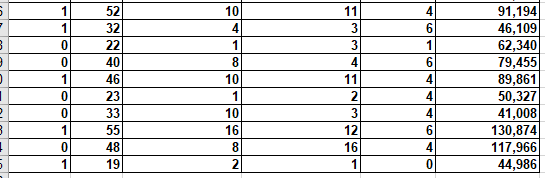
Gender 1 0 0 1 0 0 1 0 1 1 0 1 1 0 1 0 1 0 1 1 1 0 0 1 0 1 1 0 1 1 0 1 1 1 0 1 0 Age Prior Experience Beta Experience Education Annual Salary 35 7 10 4 80,450 46 15 7 6 92,912 26 1 0 4 71,214 24 4 2 4 54,750 52 21 24 7 145,285 43 10 8 4 90,442 35 8 0 6 82,207 36 14 5 4 84,331 47 13 14 6 129,489 25 2 1 4 58,118 33 8 3 6 83,956 26 1 6 0 58,439 43 13 7 4 90,638 37 8 4 6 80,167 31 6 2 0 46,371 45 6 13 6 98,613 46 13 16 5 116,927 32 4 4 4 80,556 36 12 3 4 57,183 41 16 7 4 86,712 47 11 13 8 136,473 65 18 18 4 143,588 30 3 4 4 59,901 31 5 1 4 43,100 51 13 14 130,053 47 23 2 4 71,259 36 3 10 2 59,106 4 5 4 69,224 19 3 2 4 38,743 42 5 11 6 94,965 56 8 13 4 103,388 26 3 5 0 59,014 32 6 3 6 89,205 63 11 20 4 138,763 33 4 1 6 45,829 20 1 2 2 42,784 43 7 14 4 94,199 37 6 6 4 86,932 54 13 12 9 133,278 28 5 2 2 62,100 38 14 6 4 99,987 62 11 19 4 125,471 32 1 0 0 1 0 4 10 4 1 1 1 0 0 | 0 0 6 1 6 9 52 32 22 40 6 23 33 55 48 19 8 10 1 10 16 8 2 11 3 3 41 11 2 3 12 16 4 4 4 6 4 0 1,194 46,109 62,340 79,455 89,861 50,327| 41,008 130,874 117,966| 44,986 3 | 0 Gender 1 0 0 1 0 0 1 0 1 1 0 1 1 0 1 0 1 0 1 1 1 0 0 1 0 1 1 0 1 1 0 1 1 1 0 1 0 Age Prior Experience Beta Experience Education Annual Salary 35 7 10 4 80,450 46 15 7 6 92,912 26 1 0 4 71,214 24 4 2 4 54,750 52 21 24 7 145,285 43 10 8 4 90,442 35 8 0 6 82,207 36 14 5 4 84,331 47 13 14 6 129,489 25 2 1 4 58,118 33 8 3 6 83,956 26 1 6 0 58,439 43 13 7 4 90,638 37 8 4 6 80,167 31 6 2 0 46,371 45 6 13 6 98,613 46 13 16 5 116,927 32 4 4 4 80,556 36 12 3 4 57,183 41 16 7 4 86,712 47 11 13 8 136,473 65 18 18 4 143,588 30 3 4 4 59,901 31 5 1 4 43,100 51 13 14 130,053 47 23 2 4 71,259 36 3 10 2 59,106 4 5 4 69,224 19 3 2 4 38,743 42 5 11 6 94,965 56 8 13 4 103,388 26 3 5 0 59,014 32 6 3 6 89,205 63 11 20 4 138,763 33 4 1 6 45,829 20 1 2 2 42,784 43 7 14 4 94,199 37 6 6 4 86,932 54 13 12 9 133,278 28 5 2 2 62,100 38 14 6 4 99,987 62 11 19 4 125,471 32 1 0 0 1 0 4 10 4 1 1 1 0 0 | 0 0 6 1 6 9 52 32 22 40 6 23 33 55 48 19 8 10 1 10 16 8 2 11 3 3 41 11 2 3 12 16 4 4 4 6 4 0 1,194 46,109 62,340 79,455 89,861 50,327| 41,008 130,874 117,966| 44,986 3 | 0


