

Question: A) i) Redo Example below with a. n = 200 b. n = 100 c. Describe the effect on the test statistic and the p
A) i) Redo Example below with
a.n= 200
b.n= 100
c. Describe the effect on the test statistic and thep-value whennincreases.
A) ii)Redo Example with
a. ? = 35
b. ? = 100
c. Describe the effect on the test statistic and thep-value when ? increases.
Example: Department Store's New Billing System
The manager of a department store is thinking about establishing a new billing system for the store's credit customers. After a thorough financial analysis, she determines that the new system will be cost-effective only if the mean monthly account is more than $170. A random sample of 400 monthly accounts is drawn, for which the sample mean is $178. The manager knows that the accounts are approximately normally distributed with a standard deviation of $65. Can the manager conclude from this that the new system will be cost-effective?
SOLUTION:
Identify
This example deals with the population of the credit accounts at the store. To conclude that the system will be cost-effective requires the manager to show that the mean account for all customers is greater than $170. Consequently, we set up the alternative hypothesis to express this circumstance:
(Install new system)
If the mean is less than or equal to 170, then the system will not be cost-effective. The null hypothesis can be expressed as
(Do not install new system)
However, as was discussed in Section 11-1, we will actually test ? = 170, which is how we specify the null hypothesis:
As we previously pointed out, the test statistic is the best estimator of the parameter. In Chapter 10, we used the sample mean to estimate the population mean. To conduct this test, we ask and answer the following question: Is a sample mean of 178 sufficiently greater than 170 to allow us to confidently infer that the population mean is greater than 170?
There are two approaches to answering this question. The first is called therejection region method. It can be used in conjunction with the computer, but it is mandatory for those computing statistics manually. The second is thep-value approach, which in general can be employed only in conjunction with a computer and statistical software. We recommend, however, that users of statistical software be familiar with both approaches.
iii)
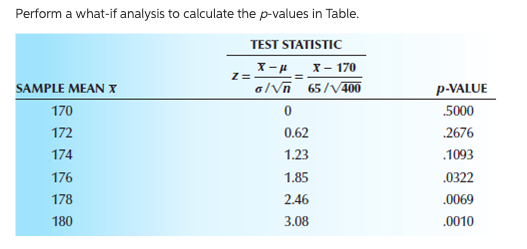
Perform a what-if analysis to calculate the p-values in Table. TEST STATISTIC X - 170 SAMPLE MEAN X o/Vn 65 /1400 P-VALUE 170 .5000 172 0.62 .2676 174 1.23 .1093 176 1.85 .0322 178 2.46 .0069 180 3.08 .0010
Step by Step Solution
There are 3 Steps involved in it

Get step-by-step solutions from verified subject matter experts