

Question: a) i) Using technology (Google Sheets), create a scatter plot 1. Use the data below to answer of time spent the following questions. watching television
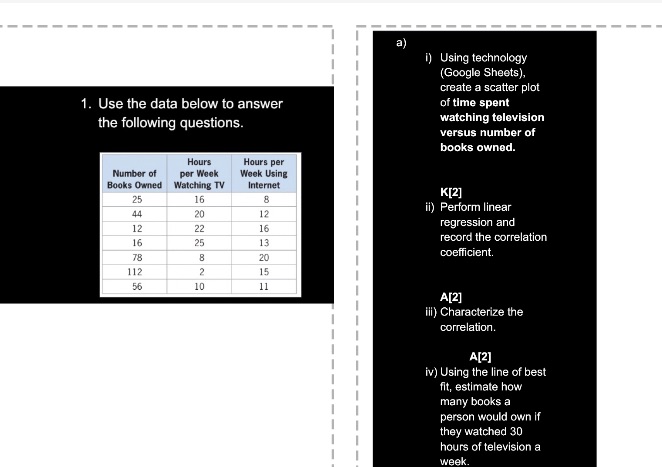

a) i) Using technology (Google Sheets), create a scatter plot 1. Use the data below to answer of time spent the following questions. watching television versus number of books owned. Hours Hours per Number of per Week Week Using Books Owned Watching TV Internet K[2] 25 16 8 44 20 12 ii) Perform linear 12 22 16 regression and 16 25 13 record the correlation 20 coefficient. 112 2 15 56 10 11 A[2] iii) Characterize the correlation. A[2] iv) Using the line of best fit, estimate how e syooq Auew person would own if they watched 30 hours of television a week
Step by Step Solution
There are 3 Steps involved in it
1 Expert Approved Answer
Step: 1 Unlock

Question Has Been Solved by an Expert!
Get step-by-step solutions from verified subject matter experts
Step: 2 Unlock
Step: 3 Unlock