

Question: a. Identify (and describe) the pattern or patterns you observe. Be as specific and complete as necessary. b. Are the weekly closing stock prices data
a. Identify (and describe) the pattern or patterns you observe. Be as specific and complete as necessary.
b. Are the weekly closing stock prices data stationary or nonstationary? Why?
c. Do the weekly closing stock prices data show a trend? Why?
d. Does the time series plot show serial correlation? If yes, state the specific type of serial correlation and why. (You may have to modify or redo your time series plot to answer this part.)
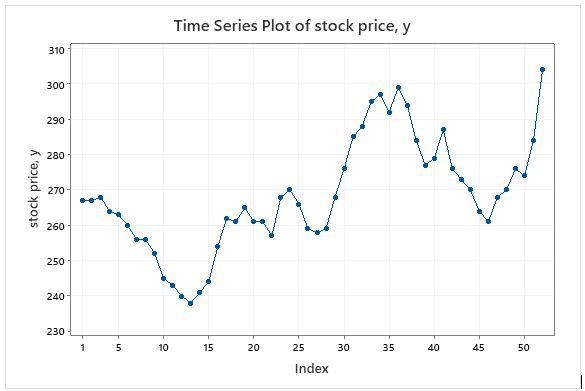
Time Series Plot of stock price, y 310 300 290 280 stock price, y 270 i 260 250 240 230 1 5 10 15 20 25 30 35 40 45 50 Index Time Series Plot of stock price, y 310 300 290 280 stock price, y 270 i 260 250 240 230 1 5 10 15 20 25 30 35 40 45 50 Index
Step by Step Solution
There are 3 Steps involved in it

Get step-by-step solutions from verified subject matter experts