

Question: (a) Identify the graph of the uniform density function. The random-number generator on calculators randomly generates a number between 0 and 1. The random variable
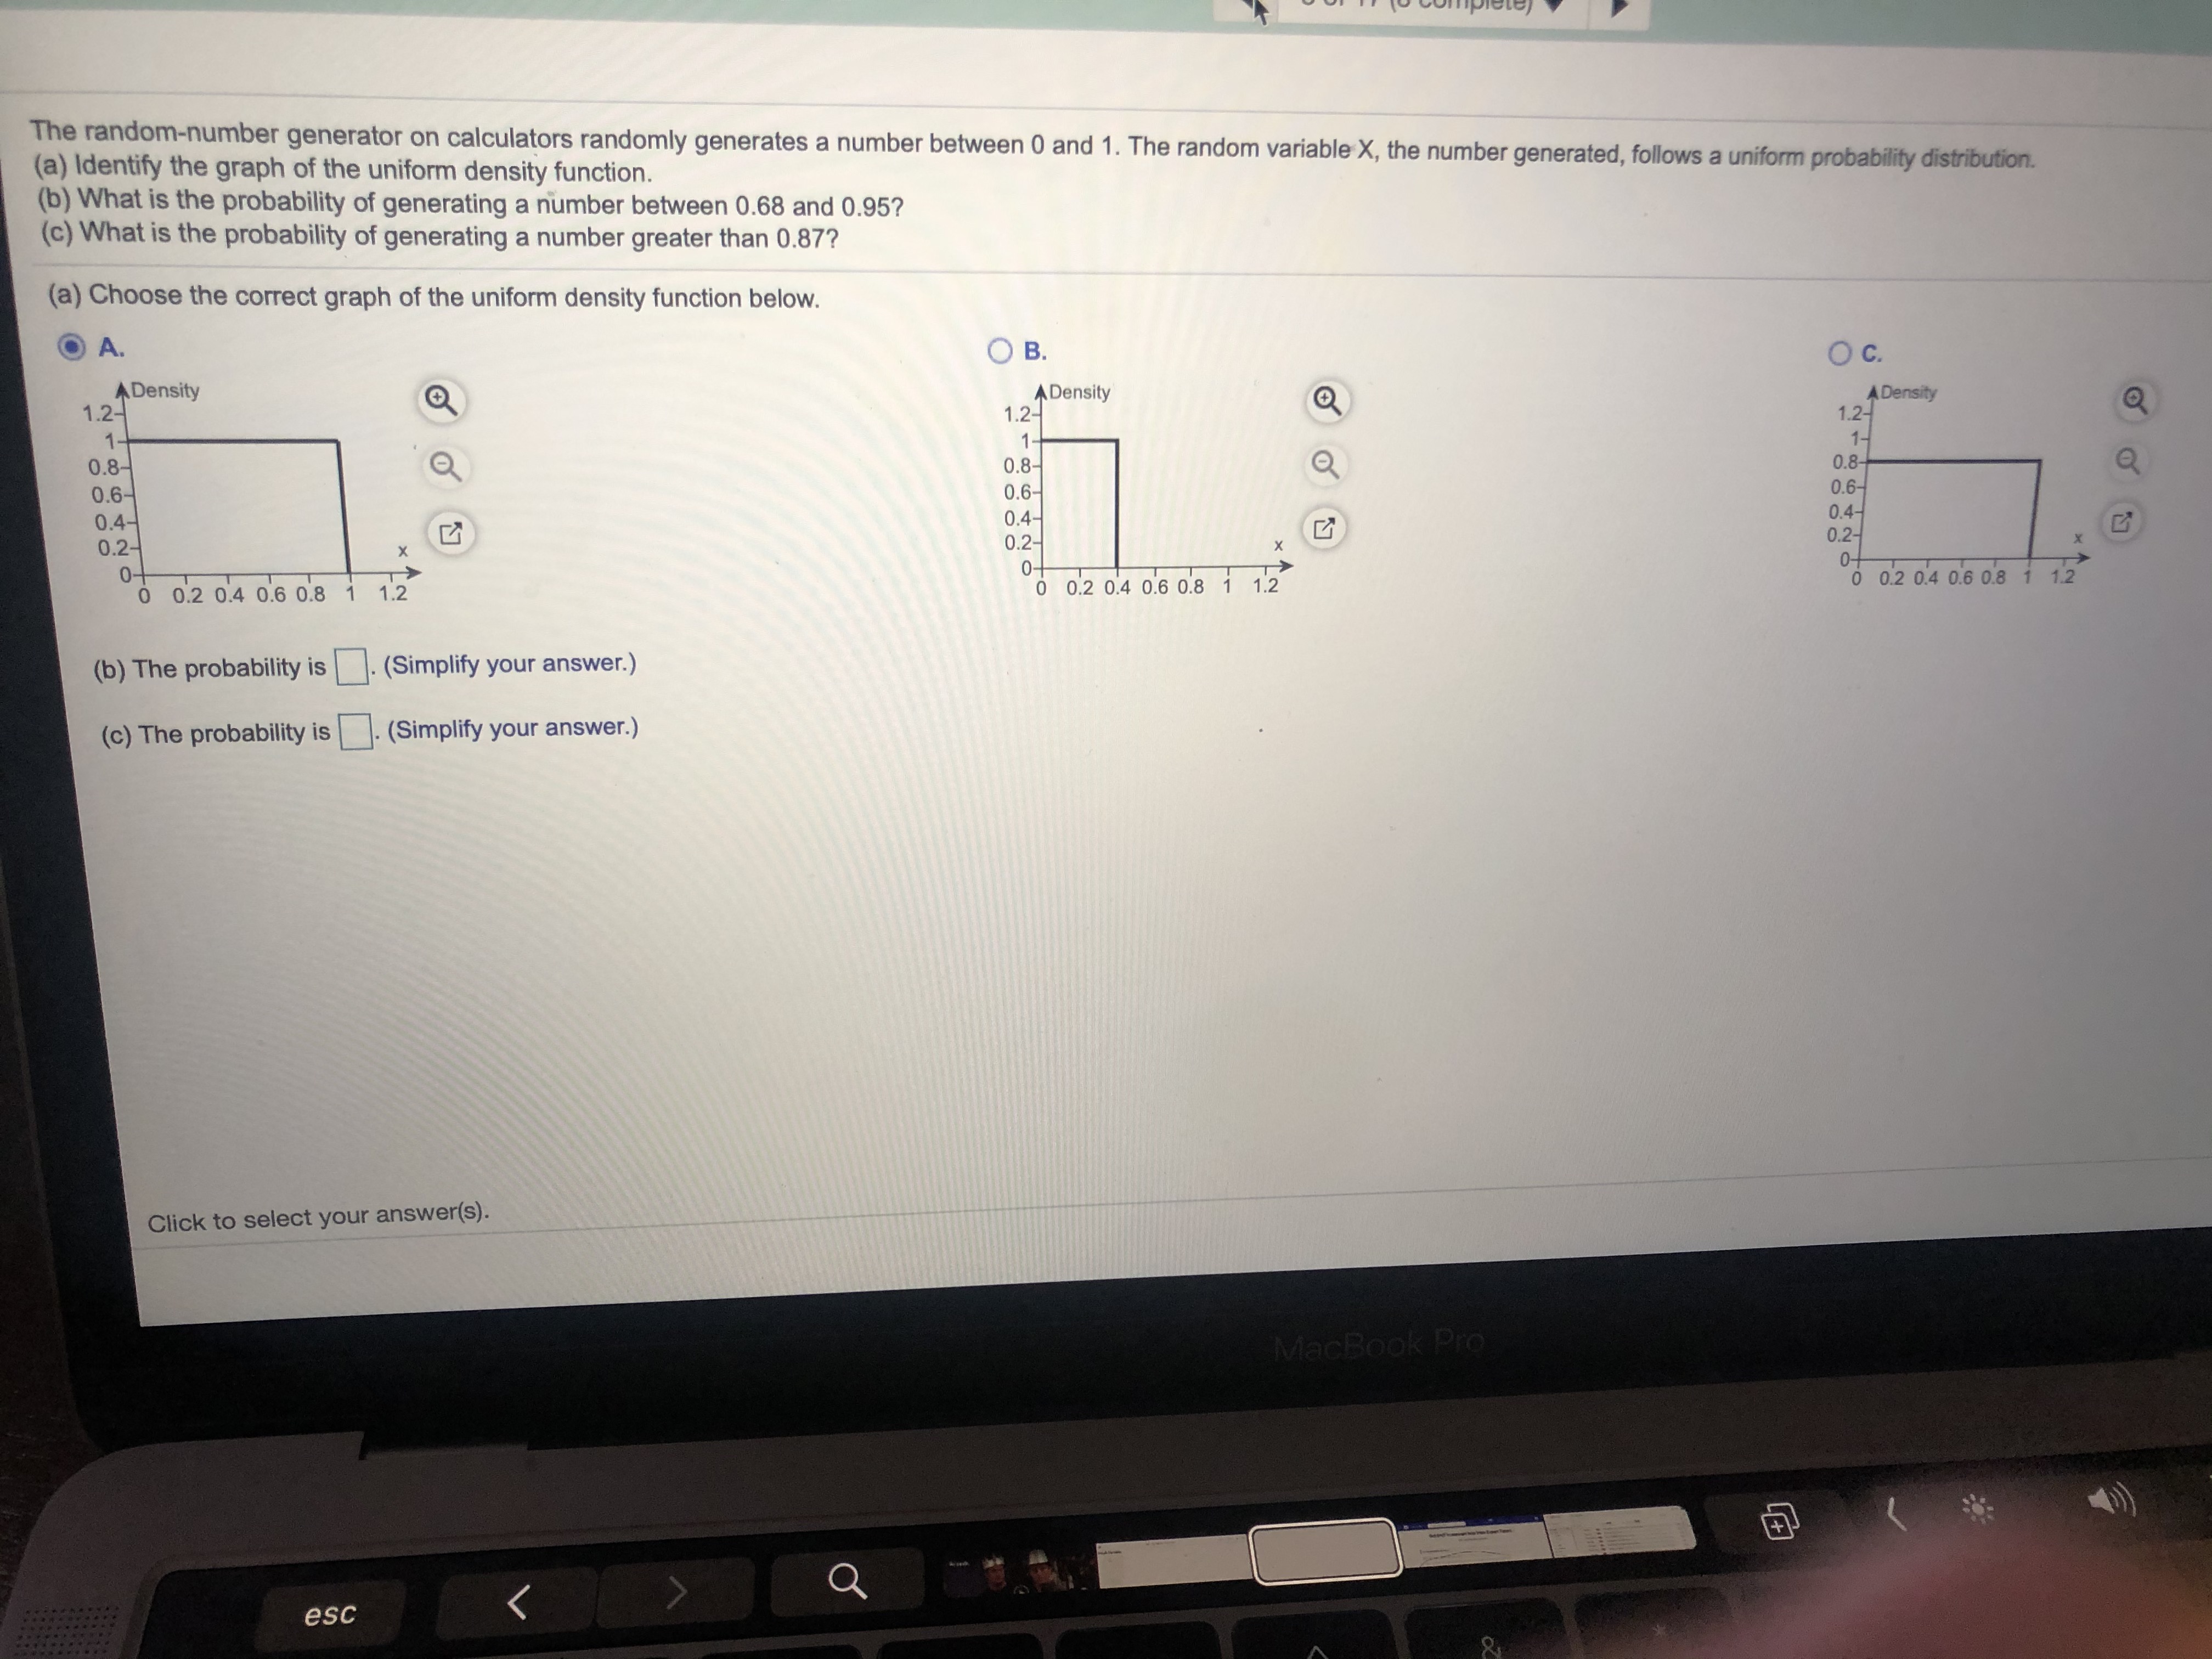
(a) Identify the graph of the uniform density function. The random-number generator on calculators randomly generates a number between 0 and 1. The random variable X, the number generated, follows a uniform probability distribution. (b) What is the probability of generating a number between 0.68 and 0.95? (c) What is the probability of generating a number greater than 0.87? (a) Choose the correct graph of the uniform density function below. A. ADensity 1.2- O B. 1 - 0.8- 1.2- A Density OC 0.6- 1- A Density 0.8- 1.2- 0.4- 0.6- 0.2 0.8- 0.4- 0.6- 0.2- 0 0.2 0.4 0.6 0.8 1 1.2 0.4- 0.2- 0 0.2 0.4 0.6 0.8 1 12 (b) The probability is . (Simplify your answer.) 0.2 0.4 0.6 0.8 1 1.2 (c) The probability is . (Simplify your answer.) Click to select your answer(s). MacBook Pro esc K
Step by Step Solution
There are 3 Steps involved in it

Get step-by-step solutions from verified subject matter experts