

Question: a. Identify the null and alternative hypotheses for this test. Let population 1 correspond to the passenger cars and population 2 correspond to the
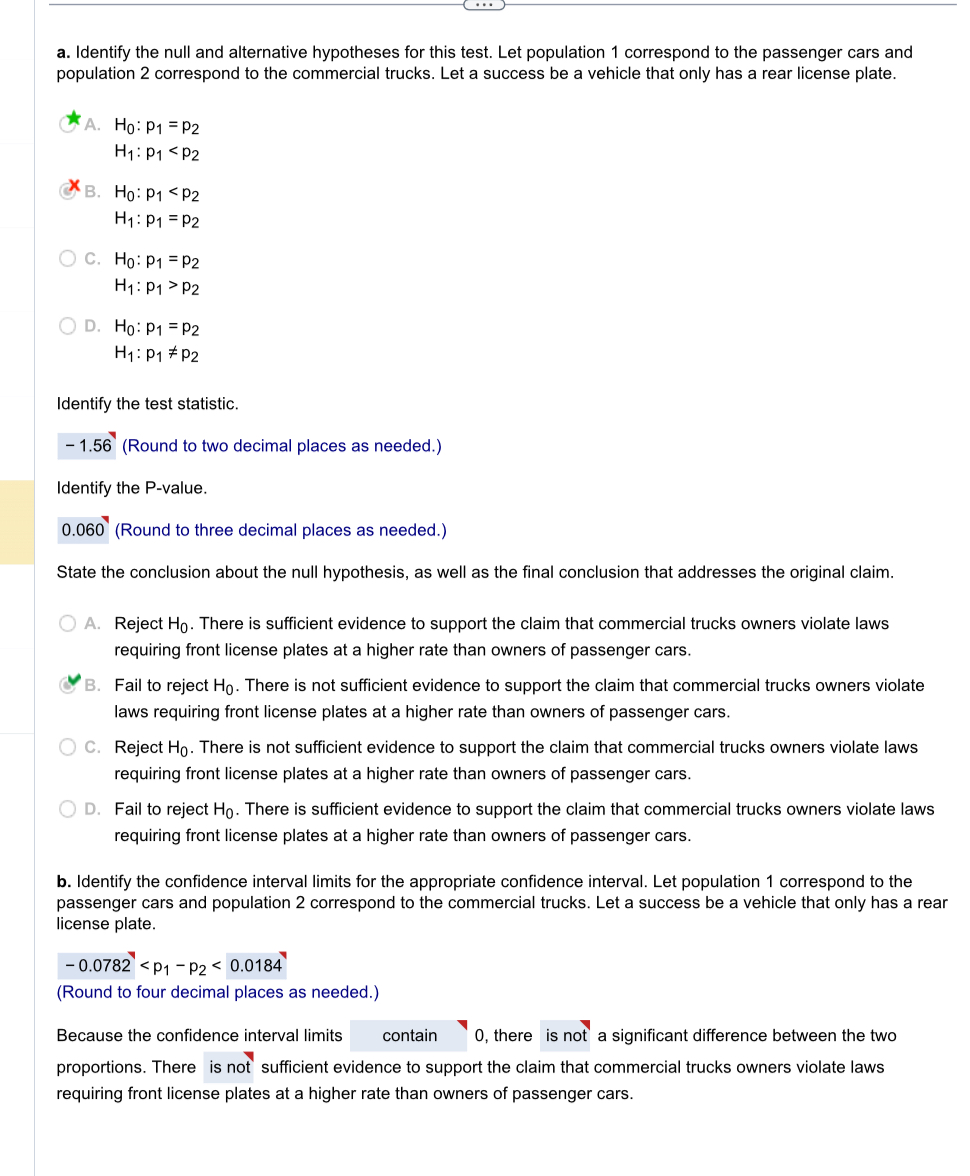
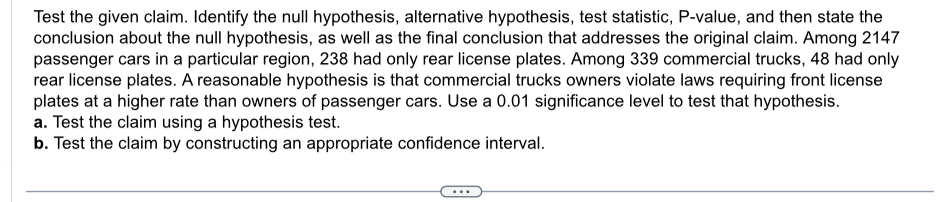
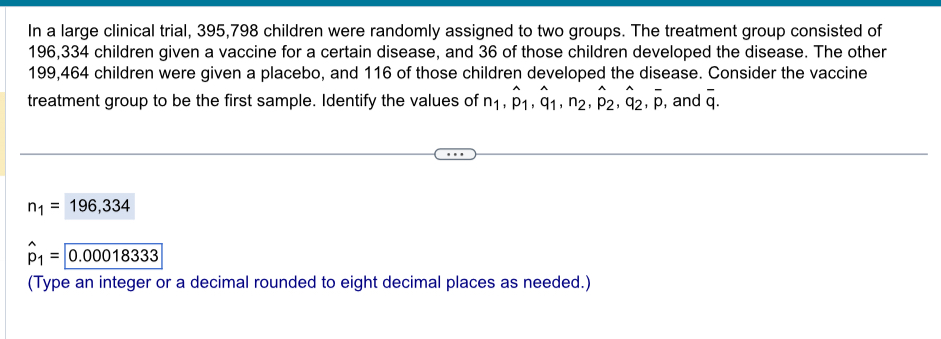
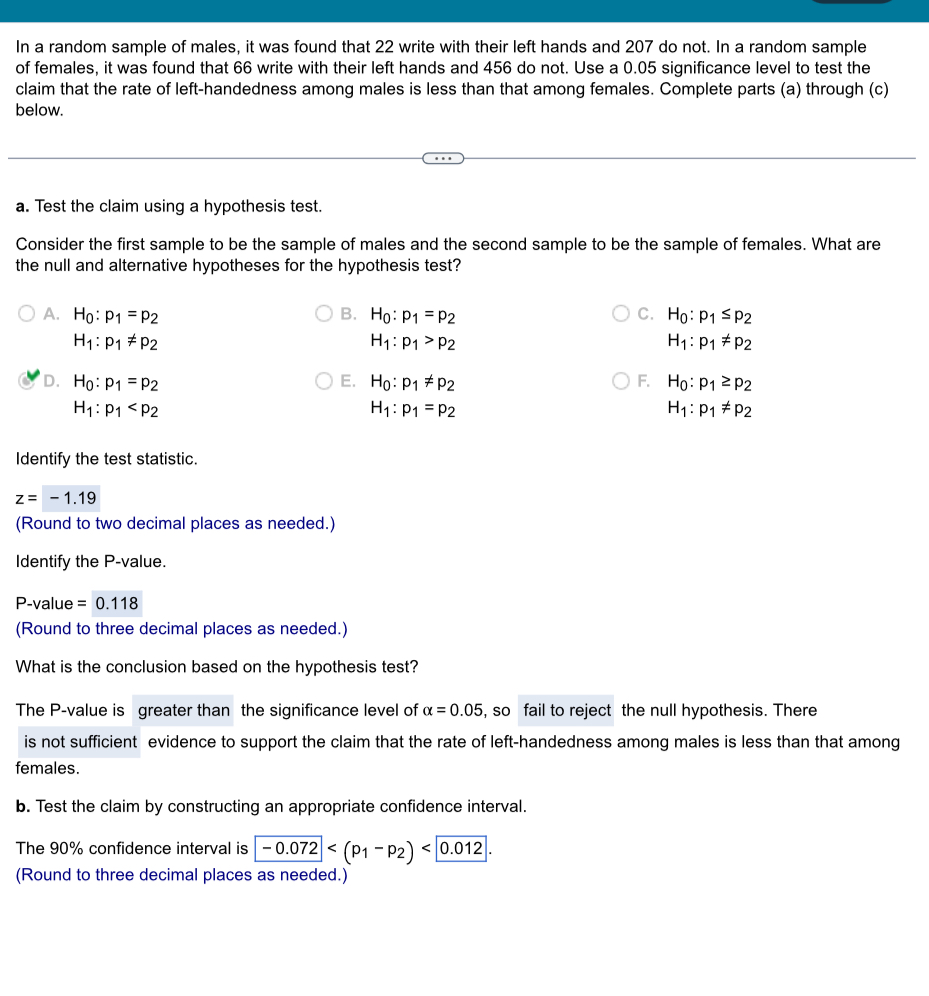
a. Identify the null and alternative hypotheses for this test. Let population 1 correspond to the passenger cars and population 2 correspond to the commercial trucks. Let a success be a vehicle that only has a rear license plate. A. Ho: P1 P2 H1: P1 P2 B. Ho: P1 P2 H1: P1 P2 OC. Ho: P1 P2 H1: P1 P2 OD. Ho: P1 P2 H1: P1 P2 Identify the test statistic. -1.56 (Round to two decimal places as needed.) Identify the P-value. 0.060 (Round to three decimal places as needed.) State the conclusion about the null hypothesis, as well as the final conclusion that addresses the original claim. A. Reject Ho. There is sufficient evidence to support the claim that commercial trucks owners violate laws requiring front license plates at a higher rate than owners of passenger cars. B. Fail to reject Ho. There is not sufficient evidence to support the claim that commercial trucks owners violate laws requiring front license plates at a higher rate than owners of passenger cars. C. Reject Ho. There is not sufficient evidence to support the claim that commercial trucks owners violate laws requiring front license plates at a higher rate than owners of passenger cars. D. Fail to reject Ho. There is sufficient evidence to support the claim that commercial trucks owners violate laws requiring front license plates at a higher rate than owners of passenger cars. b. Identify the confidence interval limits for the appropriate confidence interval. Let population 1 correspond to the passenger cars and population 2 correspond to the commercial trucks. Let a success be a vehicle that only has a rear license plate. -0.0782 Test the given claim. Identify the null hypothesis, alternative hypothesis, test statistic, P-value, and then state the conclusion about the null hypothesis, as well as the final conclusion that addresses the original claim. Among 2147 passenger cars in a particular region, 238 had only rear license plates. Among 339 commercial trucks, 48 had only rear license plates. A reasonable hypothesis is that commercial trucks owners violate laws requiring front license plates at a higher rate than owners of passenger cars. Use a 0.01 significance level to test that hypothesis. a. Test the claim using a hypothesis test. b. Test the claim by constructing an appropriate confidence interval. In a large clinical trial, 395,798 children were randomly assigned to two groups. The treatment group consisted of 196,334 children given a vaccine for a certain disease, and 36 of those children developed the disease. The other 199,464 children were given a placebo, and 116 of those children developed the disease. Consider the vaccine treatment group to be the first sample. Identify the values of n, P1, 91, n2, P2, 92, p, and q. - n = 196,334 P1 = 0.00018333 (Type an integer or a decimal rounded to eight decimal places as needed.) In a random sample of males, it was found that 22 write with their left hands and 207 do not. In a random sample of females, it was found that 66 write with their left hands and 456 do not. Use a 0.05 significance level to test the claim that the rate of left-handedness among males is less than that among females. Complete parts (a) through (c) below. a. Test the claim using a hypothesis test. Consider the first sample to be the sample of males and the second sample to be the sample of females. What are the null and alternative hypotheses for the hypothesis test? O A. Ho: P1 P2 H1 P1 P2 OB. Ho: P1 = P2 H1: P1 P2 C. Ho: P1 P2 H1: P1 P2 D. Ho: P1 P2 H1: P1 P2 OE. Ho: P1 P2 H1 P1 P2 OF. Ho: P1 P2 H1: P1 P2 Identify the test statistic. z= -1.19 (Round to two decimal places as needed.) Identify the P-value. P-value = 0.118 (Round to three decimal places as needed.) What is the conclusion based on the hypothesis test? The P-value is greater than the significance level of = 0.05, so fail to reject the null hypothesis. There is not sufficient evidence to support the claim that the rate of left-handedness among males is less than that among females. b. Test the claim by constructing an appropriate confidence interval. The 90% confidence interval is -0.072 < (P1 P2)
Step by Step Solution
There are 3 Steps involved in it

Get step-by-step solutions from verified subject matter experts