

Question: (a) Identify the null hypothesis and the alternative hypothesis. (b) Determine the test statistic. Show all work; writing the correct test statistic, without supporting work,
(a) Identify the null hypothesis and the alternative hypothesis.
(b) Determine the test statistic. Show all work; writing the correct test statistic, without supporting work, will receive no credit.
(c) Determine the P-value for this test. Show all work; writing the correct P-value, without supporting work, will receive no credit.
(d)
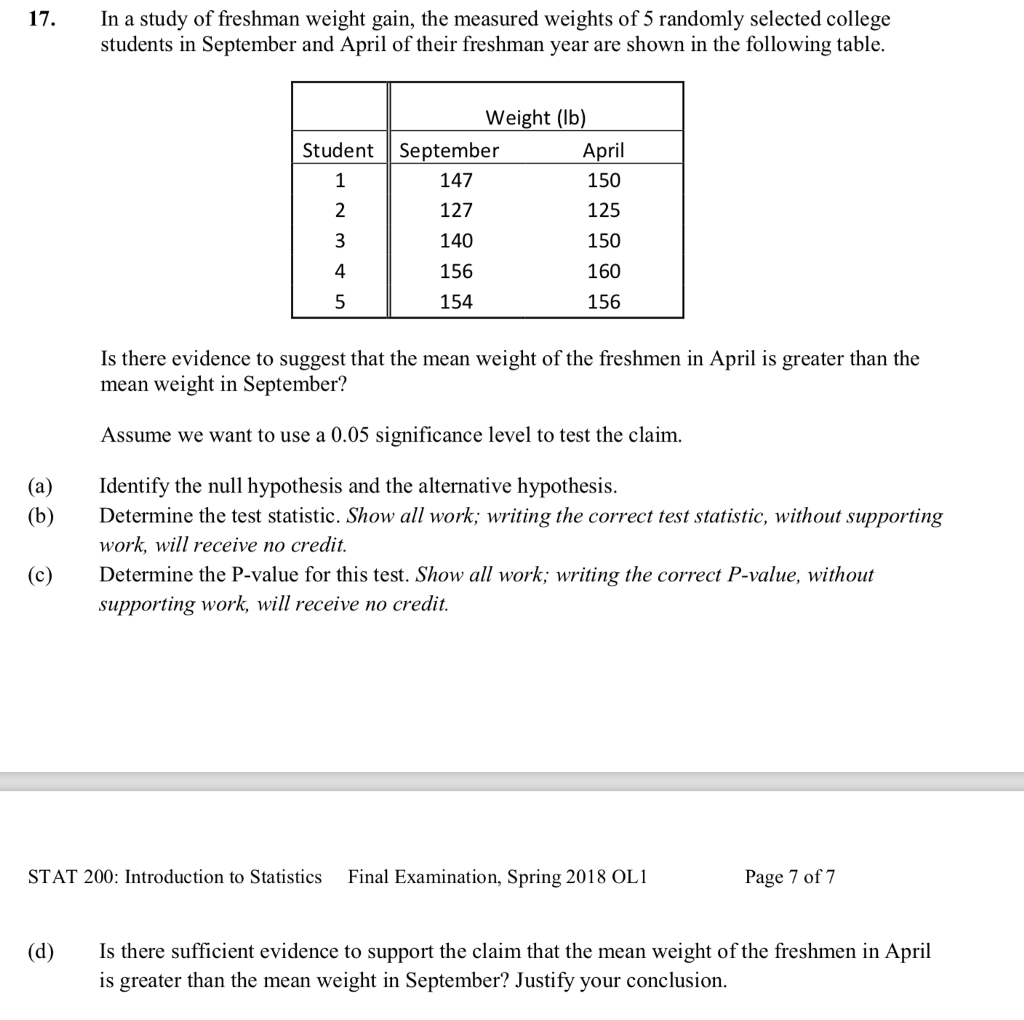
17. In a study of freshman weight gain, the measured weights of 5 randomly selected college students in September and April of their freshman year are shown in the following table. Weight (lb) September April 147 150 127 125 140 150 156 160 154 156 Is there evidence to suggest that the mean weight of the freshmen in April is greater than the mean weight in September? Assume we want to use a 0.05 signicance level to test the claim. (a) Identify the null hypothesis and the alternative hypothesis. (h) Determine the test statistic. Show all work; writing the correct test statistic, without supporting work, will receive no credit. (c) Determine the P-value for this test. Show all work; writing the correct P-value, without supporting work, will receive no credit. STAT 200'. Introduction to Statistics Final Examination, Spring 2018 0L1 Page 7 of"?[ (d) Is there sufcient evidence to support the claim that the mean weight of the freshmen in April is greater than the mean weight in September? Justify your conclusion
Step by Step Solution
There are 3 Steps involved in it

Get step-by-step solutions from verified subject matter experts