

Question: A.) If you could please help me with questions 4 and 5 ! Are the grades one receives in a course related to the amount
A.) If you could please help me with questions 4 and 5!
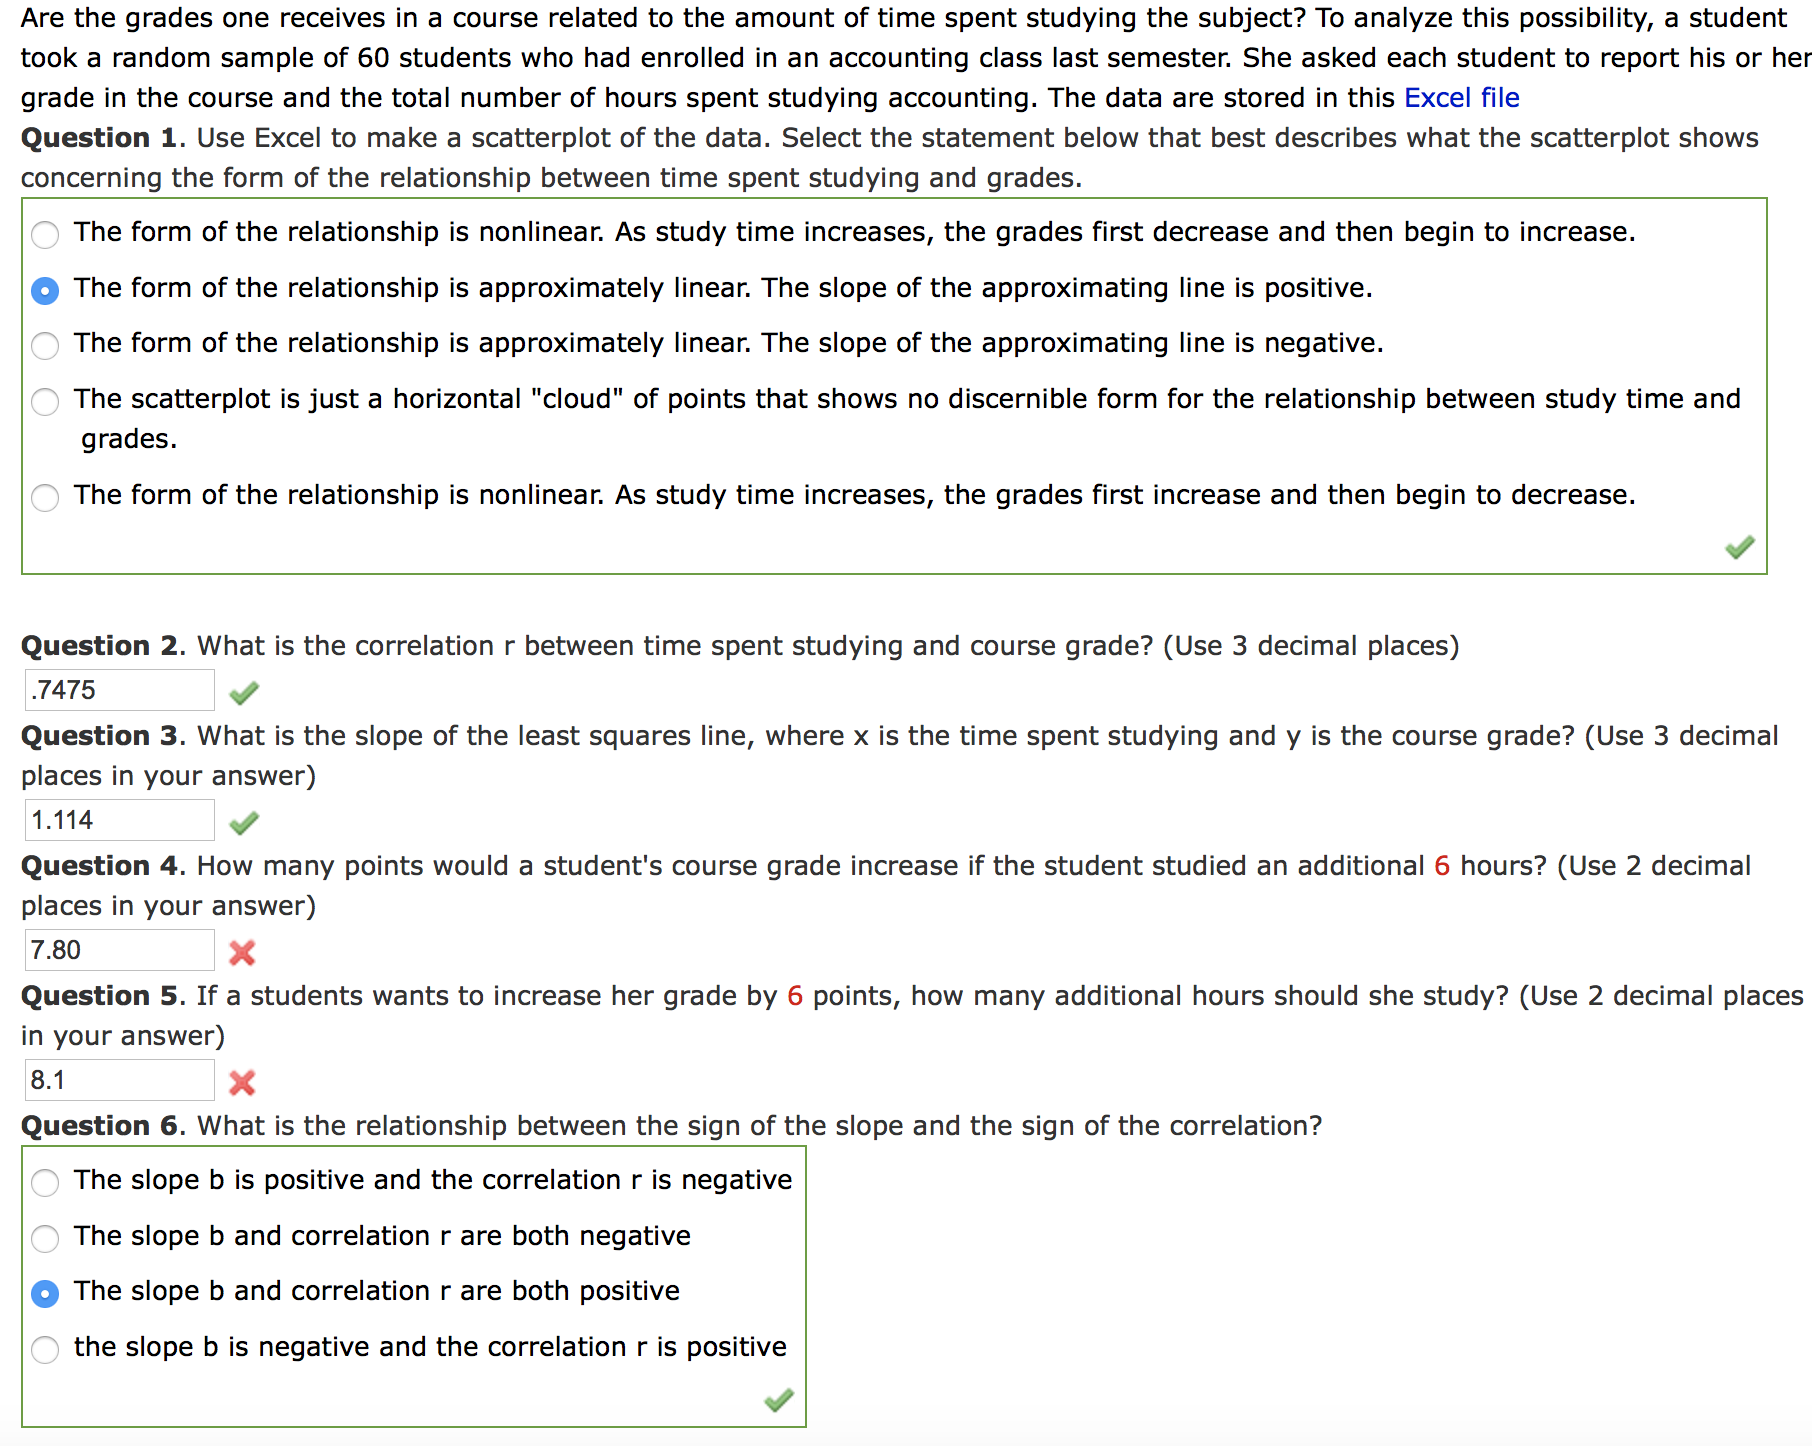
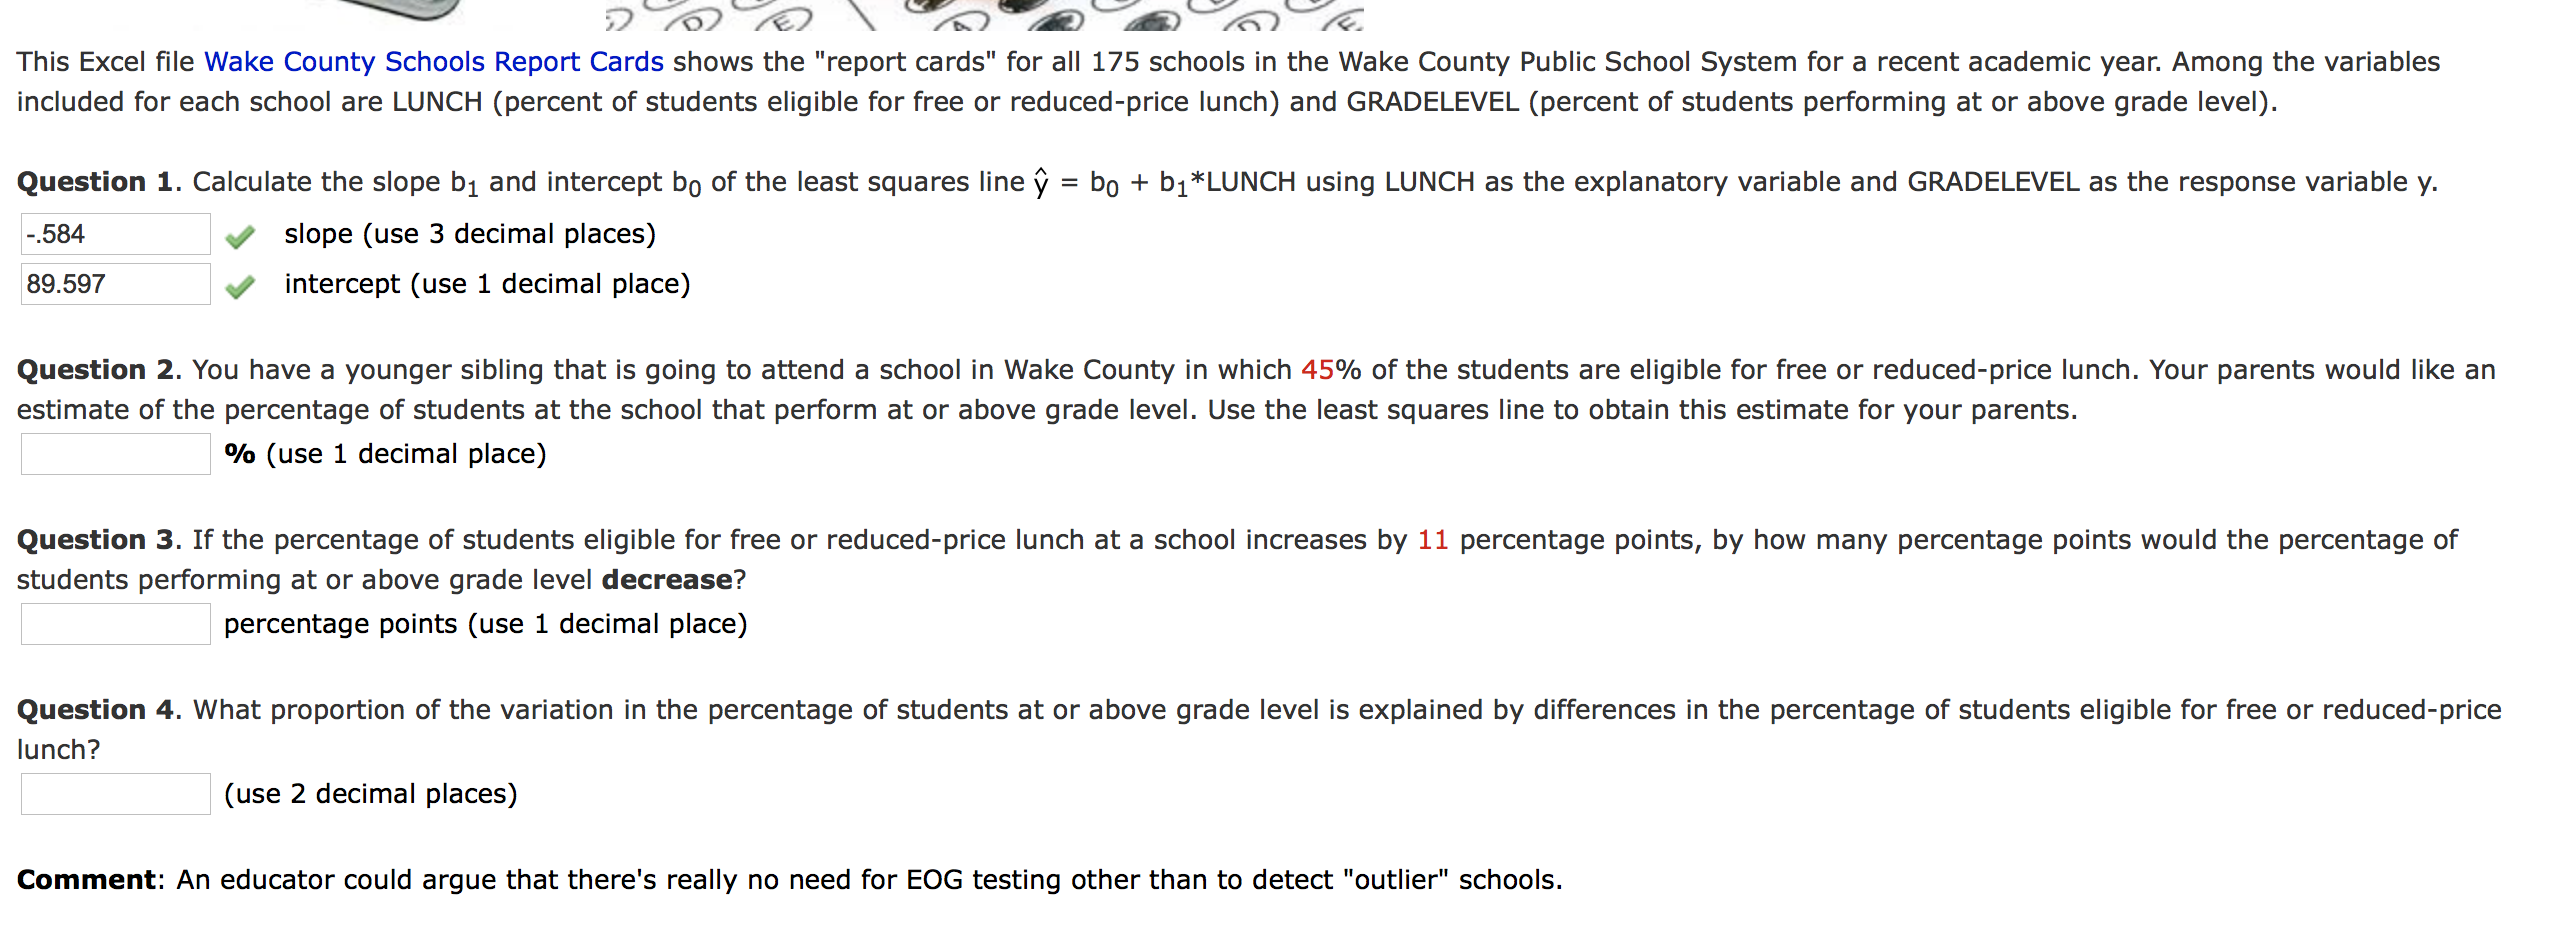
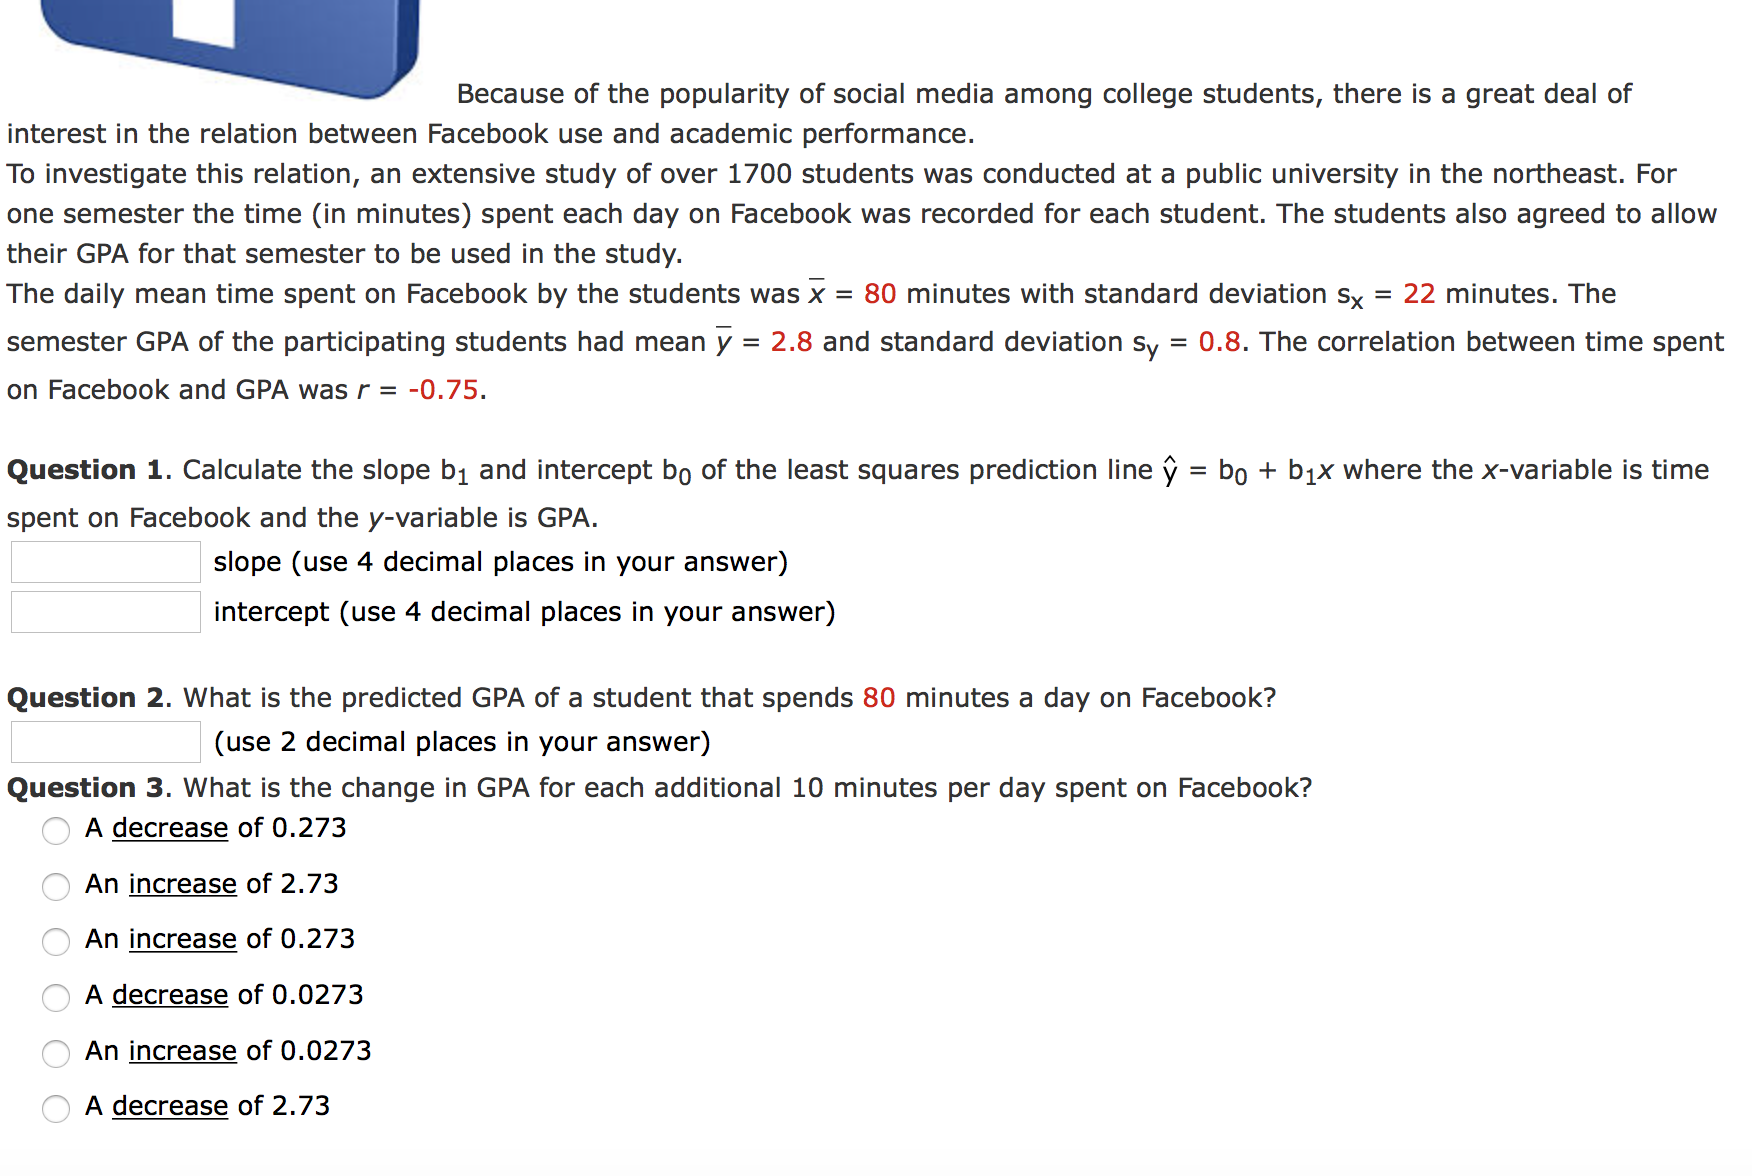
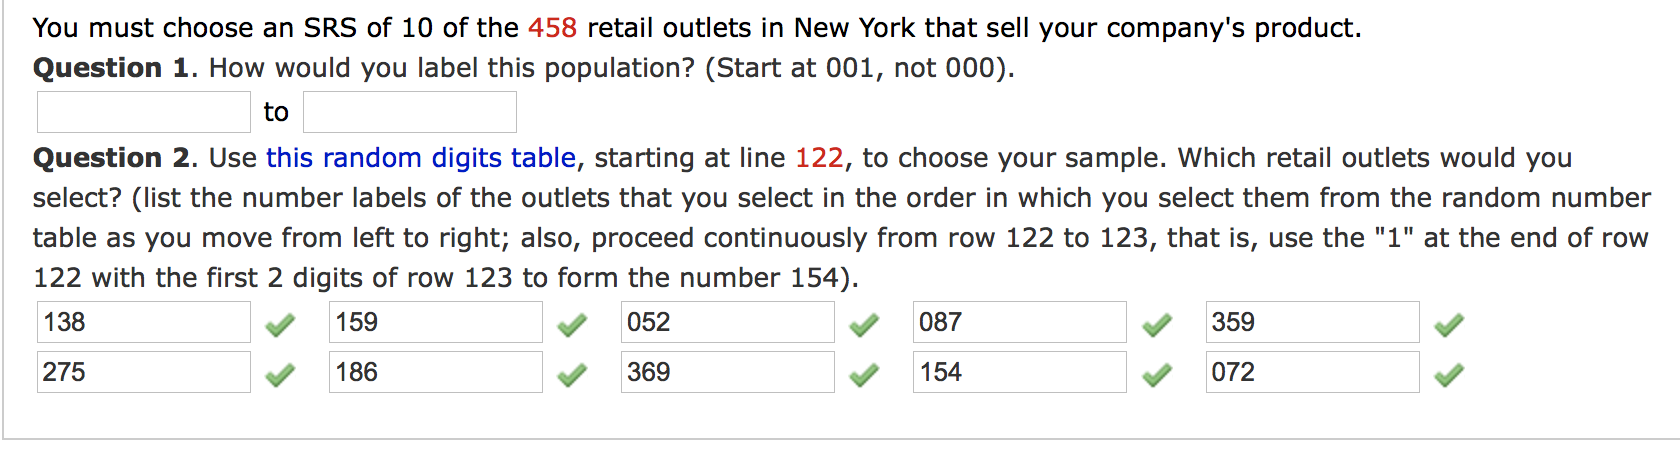
Are the grades one receives in a course related to the amount of time spent studying the subject? To analyze this possibility, a student took a random sample of 60 students who had enrolled in an accounting class last semester. She asked each student to report his or her grade in the course and the total number of hours spent studying accounting. The data are stored in this Excel le Question 1. Use Excel to make a scatterplot of the data. Select the statement below that best describes what the scatterplot shows concerning the form of the relationship between time spent studying and grades. A The form of the relationship is nonlinear. As study time increases, the grades rst decrease and then begin to increase. 0 The form of the relationship is approximately linear. The slope of the approximating line is positive. A The form of the relationship is approximately linear. The slope of the approximating line is negative. A The scatterplot is just a horizontal "cloud" of points that shows no discernible form for the relationship between study time and grades. A The form of the relationship is nonlinear. As study time increases, the grades rst increase and then begin to decrease. Question 2. What is the correlation r between time spent studying and course grade? (Use 3 decimal places) .7475 J Question 3. What is the slope of the least squares line, where x is the time spent studying and y is the course grade? (Use 3 decimal places in your answer) 1.114 J Question 4. How many points would a student's course grade increase if the student studied an additional 6 hours? (Use 2 decimal places in your answer) 7.50 x Question 5. If a students wants to increase her grade by 6 points, how many additional hours should she study? (Use 2 decimal places in your answer) 8.1 3' Question 6. What is the relationship between the sign of the slope and the sign of the correlation? -A The slope b is positive and the correlation r is negative A The slope b and correlation r are both negative 0 The slope b and correlation r are both positive A the slope b is negative and the correlation r is positive \\I V D '76) '76) \\ "/0 7.0 %%% This Excel le Wake County Schools Report Cards shows the "report cards" for all 175 schools in the Wake County Public School System for a recent academic year. Among the variables included for each school are LUNCH (percent of students eligible for free or reducedprice lunch) and GRADELEVEL (percent of students performing at or above grade level). Question 1. Calculate the slope b1 and intercept ha of the least squares line 9 = b0 + b1*LUNCH using LUNCH as the explanatory variable and GRADELEVEL as the response variable y. -.584 v slope (use 3 decimal places) 89.597 J intercept (use 1 decimal place) Question 2. You have a younger sibling that is going to attend a school in Wake County in which 45% of the students are eligible for free or reduced-price lunch. Your parents would like an estimate of the percentage of students at the school that perform at or above grade level. Use the least squares line to obtain this estimate for your parents. % (use 1 decimal place) Question 3. If the percentage of students eligible for free or reduced-price lunch at a school increases by 11 percentage points, by how many percentage points would the percentage of students performing at or above grade level decrease? percentage points (use 1 decimal place) Question 4. What proportion of the variation in the percentage of students at or above grade level is explained by differences in the percentage of students eligible for free or reducedprice lunch? (use 2 decimal places) Comment: An educator could argue that there's really no need for EOG testing other than to detect "outlier" schools. - Because of the popularity of social media among college students, there is a great deal of interest in the relation between Facebook use and academic performance. To investigate this relation, an extensive study of over 1700 students was conducted at a public university in the northeast. For one semester the time (in minutes) spent each day on Facebook was recorded for each student. The students also agreed to allow their GPA for that semester to be used in the study. The daily mean time spent on Facebook by the students was )7 = 80 minutes with standard deviation 5)( = 22 minutes. The semester GPA of the participating students had mean )7 = 2.8 and standard deviation sy = 0.8. The correlation between time spent on Facebook and GPA was r = -0.75. Question 1. Calculate the slope b1 and intercept ha of the least squares prediction line 9 = b0 + b1x where the xvariable is time spent on Facebook and the y-variable is GPA. slope (use 4 decimal places in your answer) intercept (use 4 decimal places in your answer) Question 2. What is the predicted GPA of a student that spends 80 minutes a day on Facebook? (use 2 decimal places in your answer) Question 3. What is the change in GPA for each additional 10 minutes per day spent on Facebook? C\"- A decrease of 0.273 C\" An increase of 2.73 C_\"- An increase of 0.273 C\" A decrease of 0.0273 '\" An m of 0.0273 C\"- A decrease of 2.73 You must choose an SR5 of 10 of the 458 retail outlets in New York that sell your company's product. Question 1. How would you label this population? (Start at 001, not 000). to Question 2. Use this random digits table, starting at line 122, to choose your sample. Which retail outlets would you select? (list the number labels of the outlets that you select in the order in which you select them from the random number table as you move from left to right; also, proceed continuously from row 122 to 123, that is, use the "1" at the end of row 122 with the first 2 digits of row 123 to form the number 154). 133 y 159 y 052 y 087 q 359 q \\I 275 J 186 J 369 J 154 072
Step by Step Solution
There are 3 Steps involved in it

Get step-by-step solutions from verified subject matter experts