

Question: a) In each case, describe the speaker setup that would create the sound waves shown in the graphs. That is: . are the speakers wired
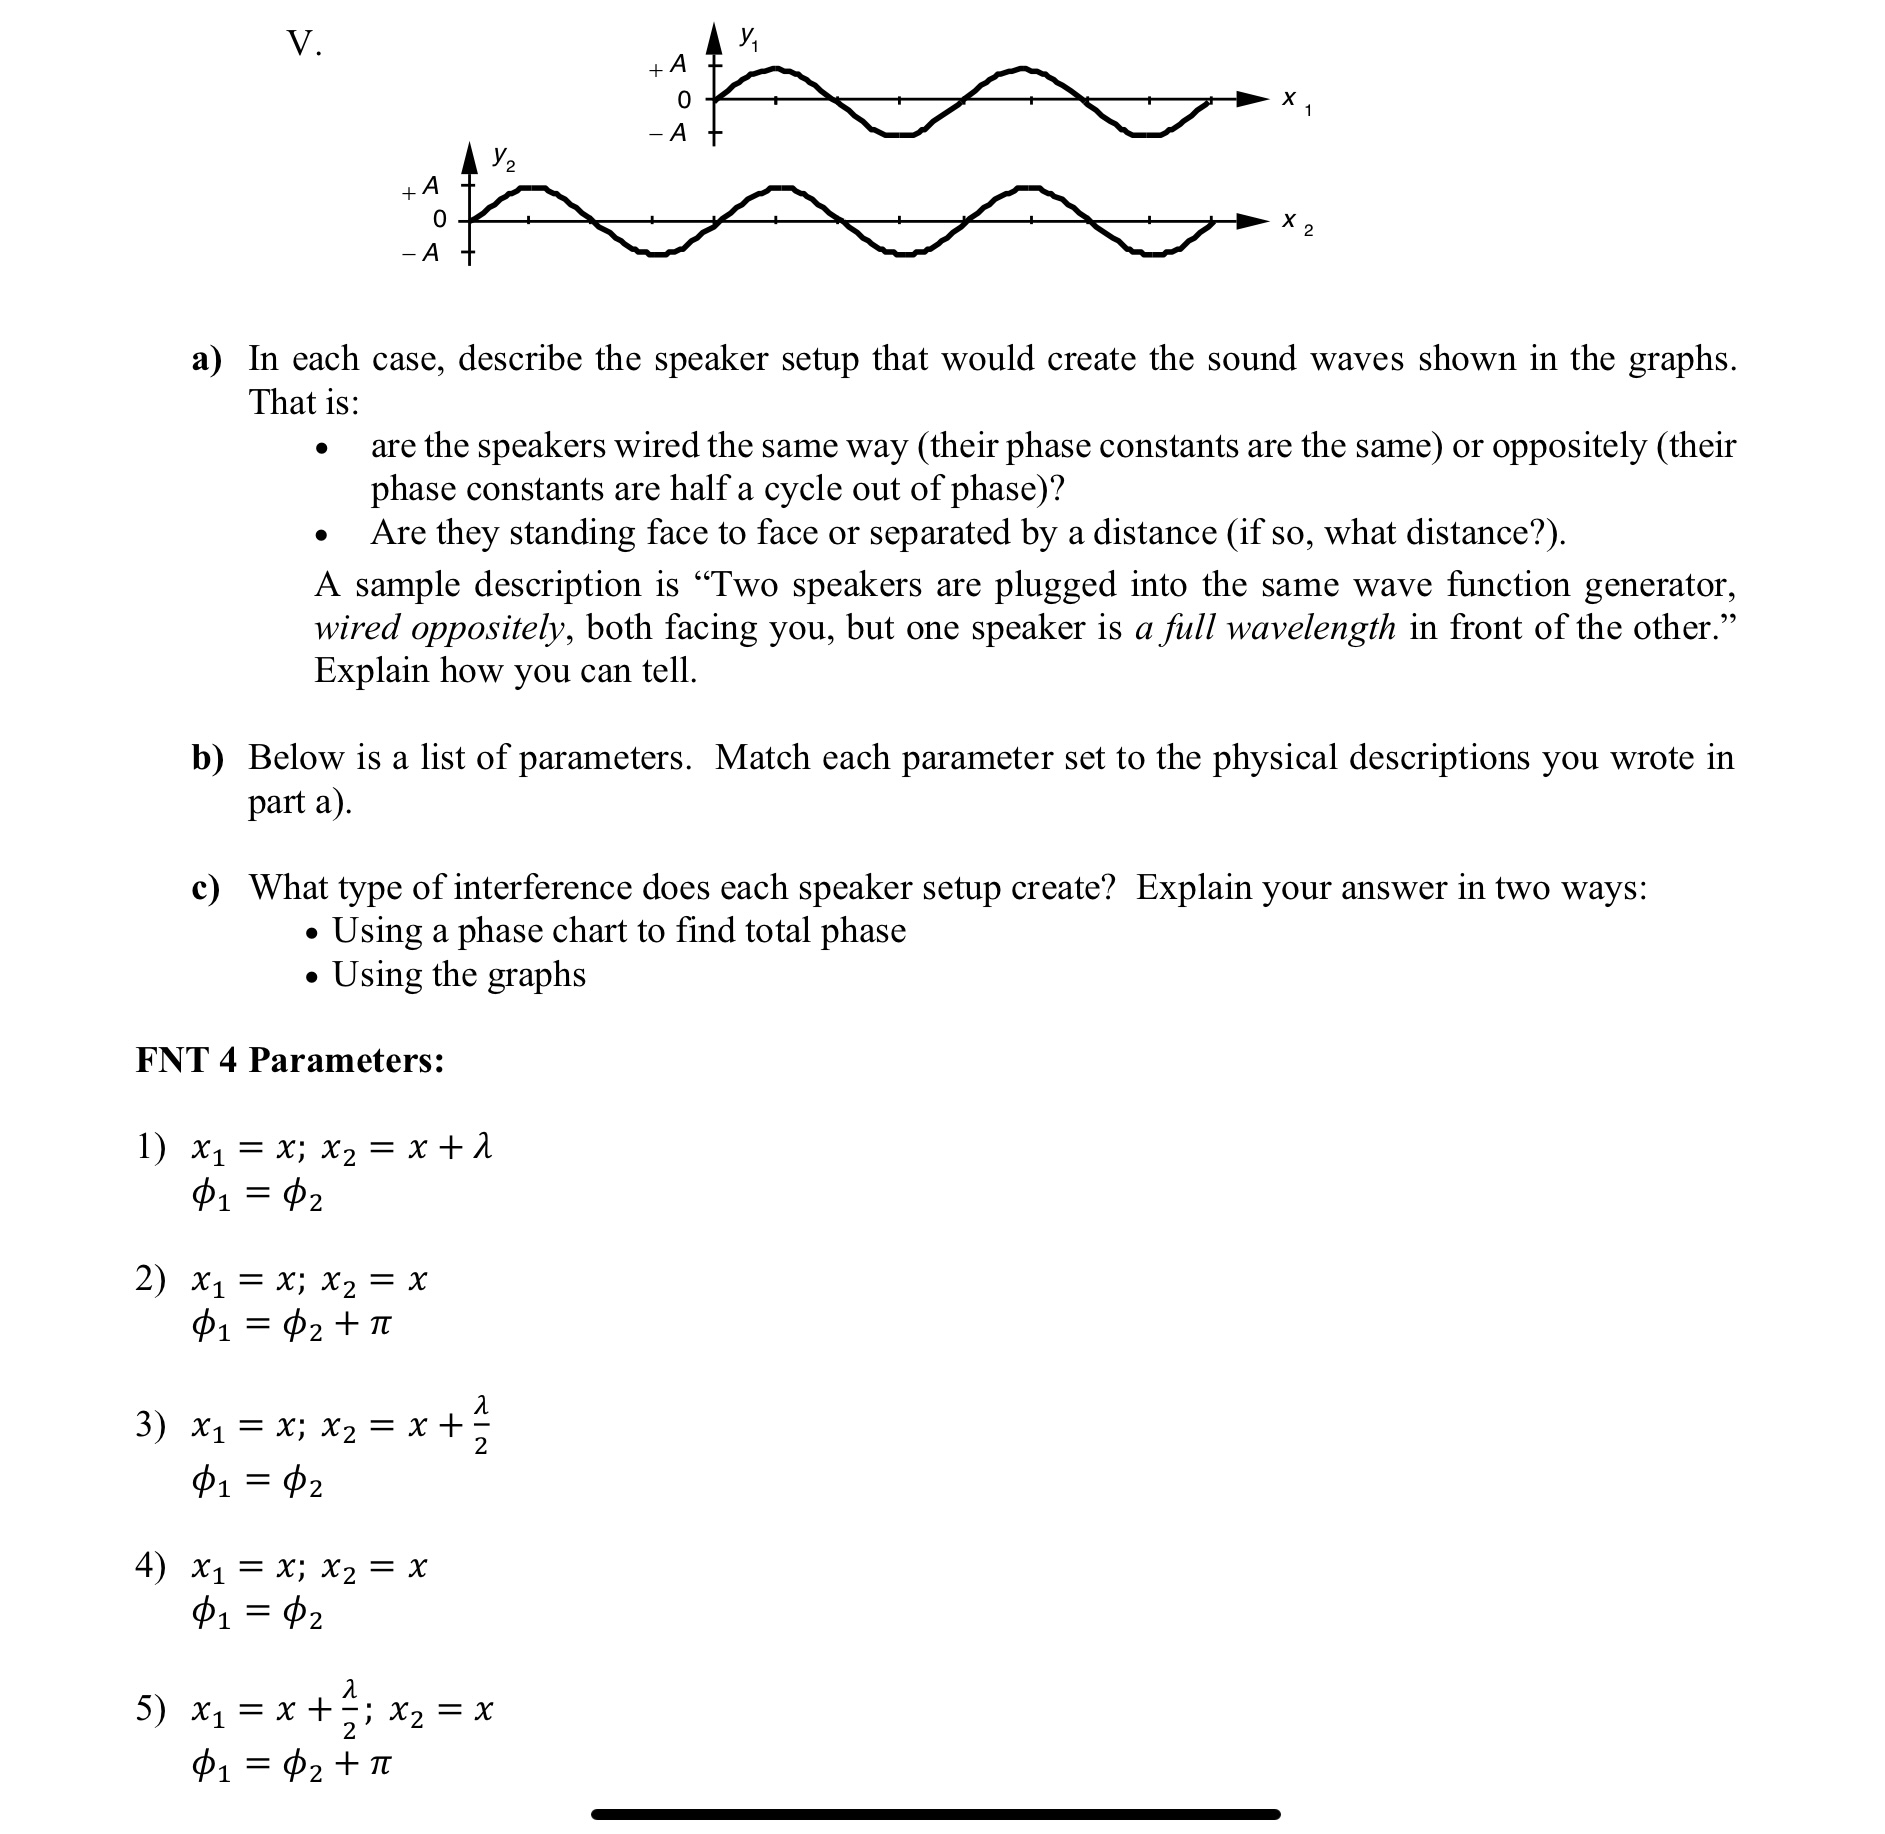
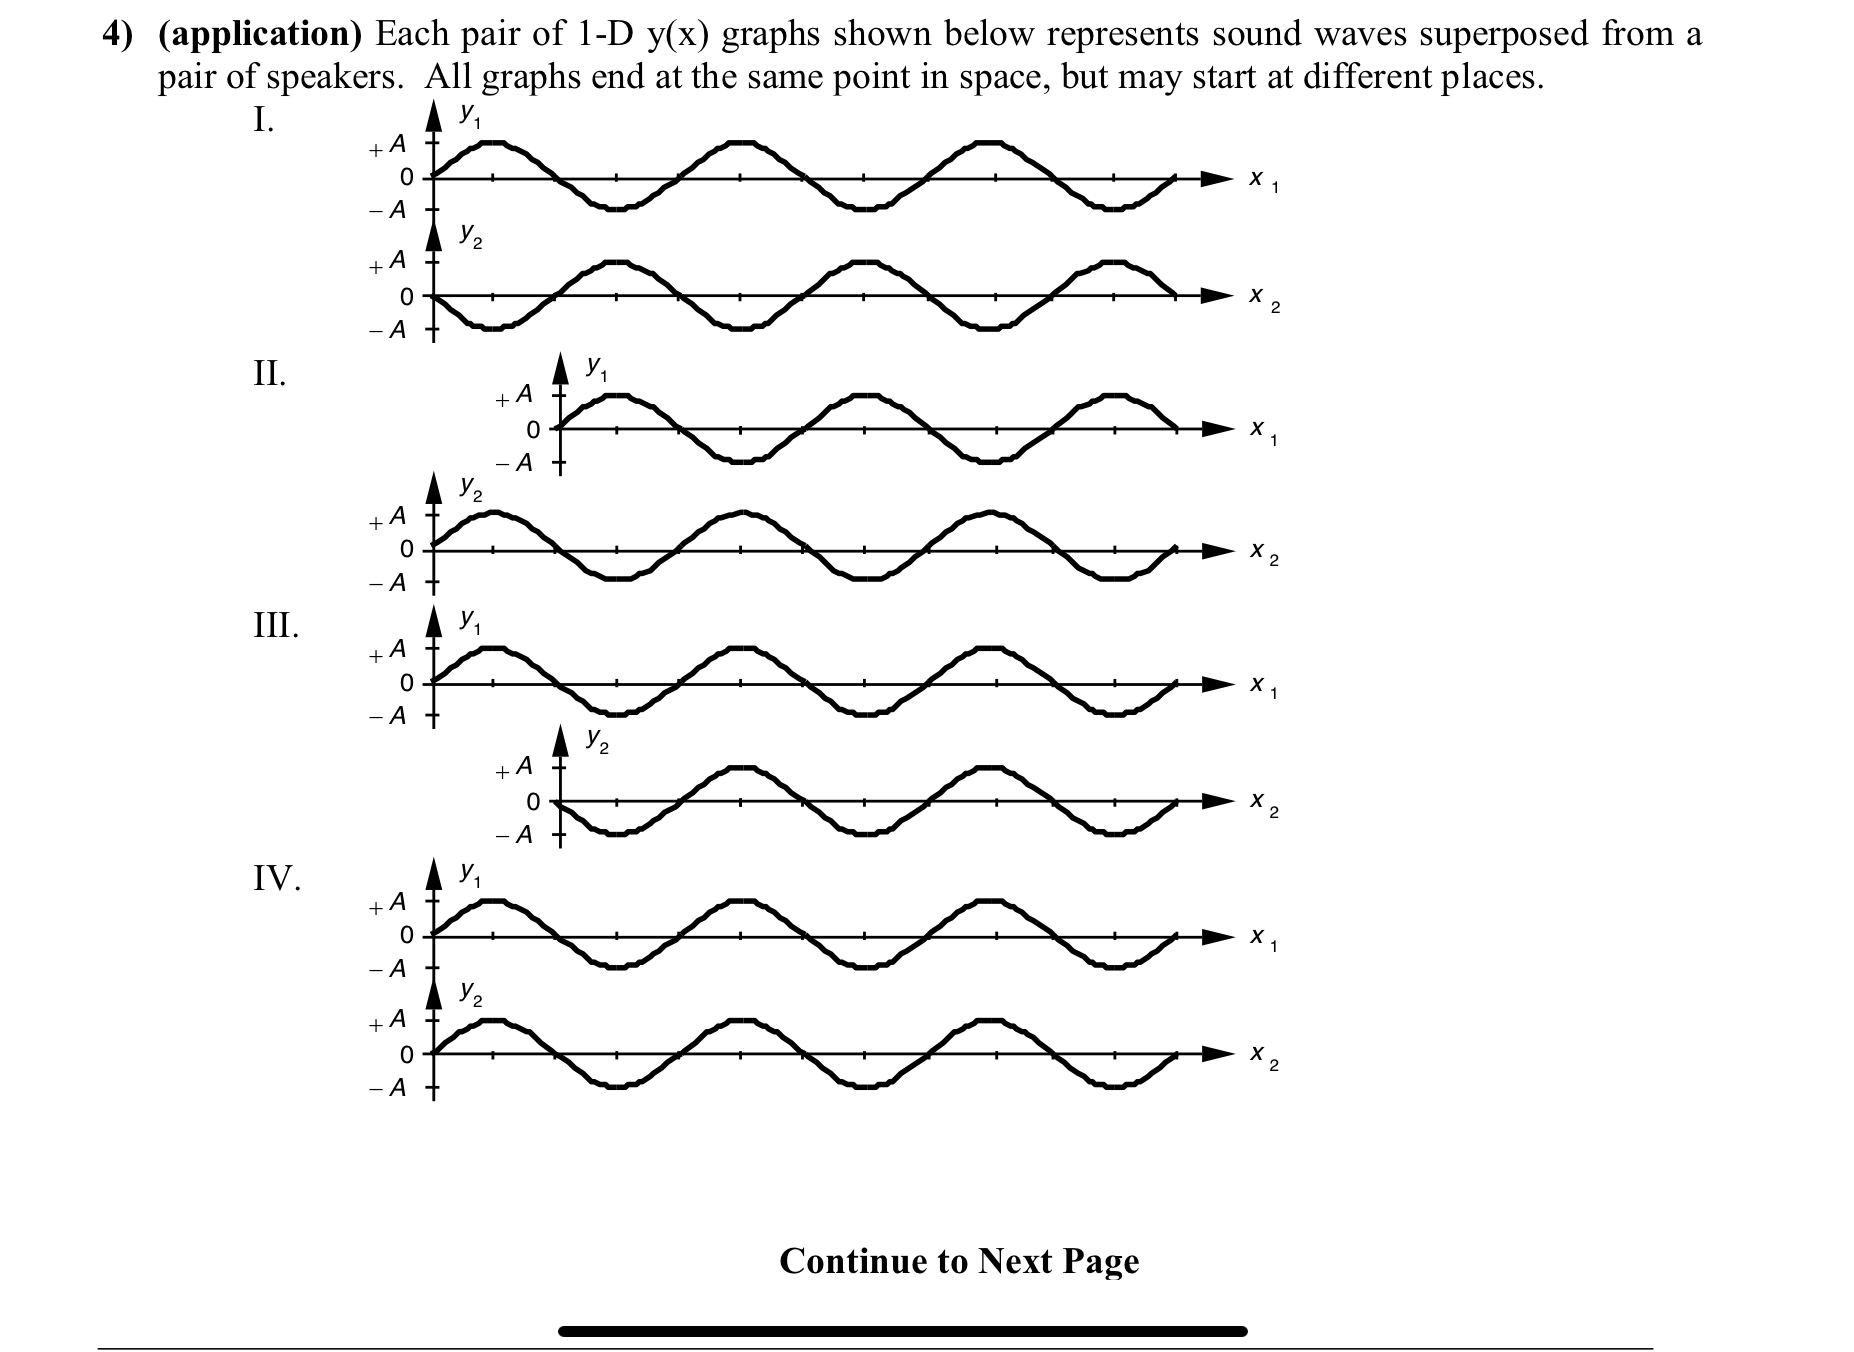
a) In each case, describe the speaker setup that would create the sound waves shown in the graphs. That is: . are the speakers wired the same way (their phase constants are the same) or oppositely (their phase constants are half a cycle out of phase)? . Are they standing face to face or separated by a distance (if so, what distance?) A sample description is \"Two speakers are plugged into the same wave function generator, wired oppositely, both facing you, but one speaker is a full wavelength in front of the other.\" Explain how you can tell. b) Below is a list of parameters. Match each parameter set to the physical descriptions you wrote in part a). c) What type of interference does each speaker setup create? Explain your answer in two ways: 0 Using a phase chart to find total phase 0 Using the graphs FNT 4 Parameters: 1) x1=x;x2=x+/1 1=2 2) x1=x;x2=x 1=2+7T A 3) x1=x;x2=x+ 1=2 4) x1=x;x2=x 1=2 5) x1=x+;x2=x 1=2+7T 4) (application) Each pair of 1-D y(x) graphs shown below represents sound waves superposed from a pair of speakers. All graphs end at the same point in space, but may start at different places. I. y 1 .V II. +A 1 0 x1 7A III. Y1 +A 0 x1 7A IV. 3'1 Continue to Next Page
Step by Step Solution
There are 3 Steps involved in it

Get step-by-step solutions from verified subject matter experts