

Question: A. In Graph A: 1. Drawing in and using the Money Supply line/curve, graphically demonstrate the derivation of theMarket Interest rate. 2. Graphically demonstrate what
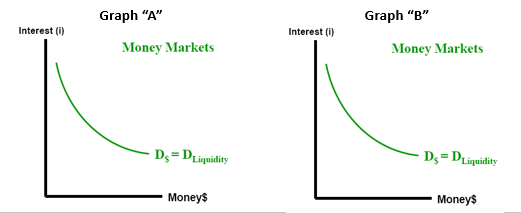
A. In Graph "A":
1. Drawing in and using the Money Supply line/curve, graphically demonstrate the derivation of the"Market Interest" rate.
2. Graphically demonstrate what would happen to Money Supply line/curve as the Fed. Reserve expands excess reserves in the banking system.
3. Graphically demonstrate what would happen to the "Market Interest" rate as this happens.
?
B. In Graph "B":
1. Graphically identify changes in the Demand for Liquidity curve that would likely result from an expanding GDP, an elevation in inflation rate and/or a serious unplanned event in the financial markets.
?
2. What is the most common money supply response of the Federal Reserve Bank to such changes in "Market Interest" rates?
\f
Step by Step Solution
There are 3 Steps involved in it

Get step-by-step solutions from verified subject matter experts