

Question: A) In what category does this type of problem fall? B) The stock with the least expected return is C) The safest stock is D)
 A) In what category does this type of problem fall?
B) The stock with the least expected return is
C) The safest stock is
D) At the desired return of 7%, the optimal proportions are
E) At a desired return of 7%, the optimal portfolio standard deviation is
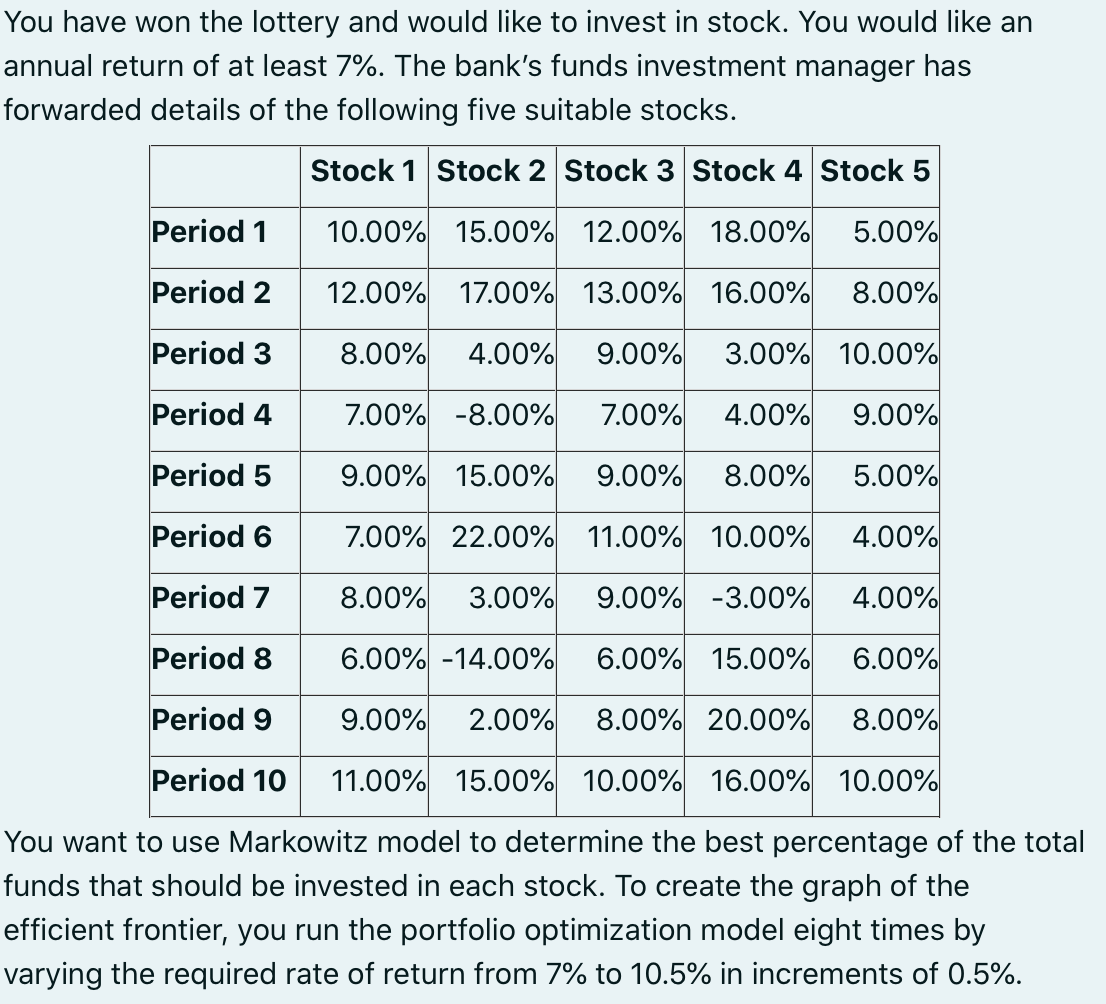
You have won the lottery and would like to invest in stock. You would like an annual return of at least 7%. The bank's funds investment manager has forwarded details of the following five suitable stocks. Stock 1 Stock 2 Stock 3 Stock 4 Stock 5 Period 1 10.00% 15.00% 12.00% 18.00% 5.00% Period 2 12.00% 17.00% 13.00% 16.00% 8.00% Period 3 8.00% 4.00% 9.00% 3.00% 10.00% Period 4 7.00% -8.00% 7.00% 4.00% 9.00% Period 5 9.00% 15.00% 9.00% 8.00% 5.00% Period 6 7.00% 22.00% 11.00% 10.00% 4.00% Period 7 8.00% 3.00% 9.00% -3.00% 4.00% Period 8 6.00% -14.00% 6.00% 15.00% 6.00% Period 9 9.00% 2.00% 8.00% 20.00% 8.00% Period 10 11.00% 15.00% 10.00% 16.00% 10.00% You want to use Markowitz model to determine the best percentage of the total funds that should be invested in each stock. To create the graph of the efficient frontier, you run the portfolio optimization model eight times by varying the required rate of return from 7% to 10.5% in increments of 0.5%. You have won the lottery and would like to invest in stock. You would like an annual return of at least 7%. The bank's funds investment manager has forwarded details of the following five suitable stocks. Stock 1 Stock 2 Stock 3 Stock 4 Stock 5 Period 1 10.00% 15.00% 12.00% 18.00% 5.00% Period 2 12.00% 17.00% 13.00% 16.00% 8.00% Period 3 8.00% 4.00% 9.00% 3.00% 10.00% Period 4 7.00% -8.00% 7.00% 4.00% 9.00% Period 5 9.00% 15.00% 9.00% 8.00% 5.00% Period 6 7.00% 22.00% 11.00% 10.00% 4.00% Period 7 8.00% 3.00% 9.00% -3.00% 4.00% Period 8 6.00% -14.00% 6.00% 15.00% 6.00% Period 9 9.00% 2.00% 8.00% 20.00% 8.00% Period 10 11.00% 15.00% 10.00% 16.00% 10.00% You want to use Markowitz model to determine the best percentage of the total funds that should be invested in each stock. To create the graph of the efficient frontier, you run the portfolio optimization model eight times by varying the required rate of return from 7% to 10.5% in increments of 0.5%
Step by Step Solution
There are 3 Steps involved in it
1 Expert Approved Answer
Step: 1 Unlock

Question Has Been Solved by an Expert!
Get step-by-step solutions from verified subject matter experts
Step: 2 Unlock
Step: 3 Unlock