

Question: (a) In your own words, explain what data analytics is and (b) what machine learning (ML) is. (c) Give at least two (2) real-world examples
- (a) In your own words, explain what data analytics is and (b) what machine learning (ML) is. (c) Give at least two (2) real-world examples that explain how analytics or ML is used in business. use this reference in your answer: Maskata, B. (2023). Data Analytics with R. In Principles of Data Analytics and Statistical Learning. Springer Nature.
- R/data task.
- Create and share an R Script to share with me. Include your code for the remaining R/data tasks in it.use this reference in your answer: Maskata, B. (2023). Data Analytics with R. In Principles of Data Analytics and Statistical Learning. Springer Nature.
- Create a data frame with two variables, Age and Dog, for five random people. The ages of these people are 72, 54, 41, 22, and 37. For these five people, the first three have a dog and the last two do not. Assign a 1 for those who have a dog and a 0 for those who do not.
- Use the describe() function from the psych package to calculate descriptive statistics. What is the mean and standard deviation of the Age variable?(Hint: You need to first download the psych package and then load it to your session.)
- Create a table that shows the number of people who have a dog and the number of people who do not have a dog. You can use the table() function.
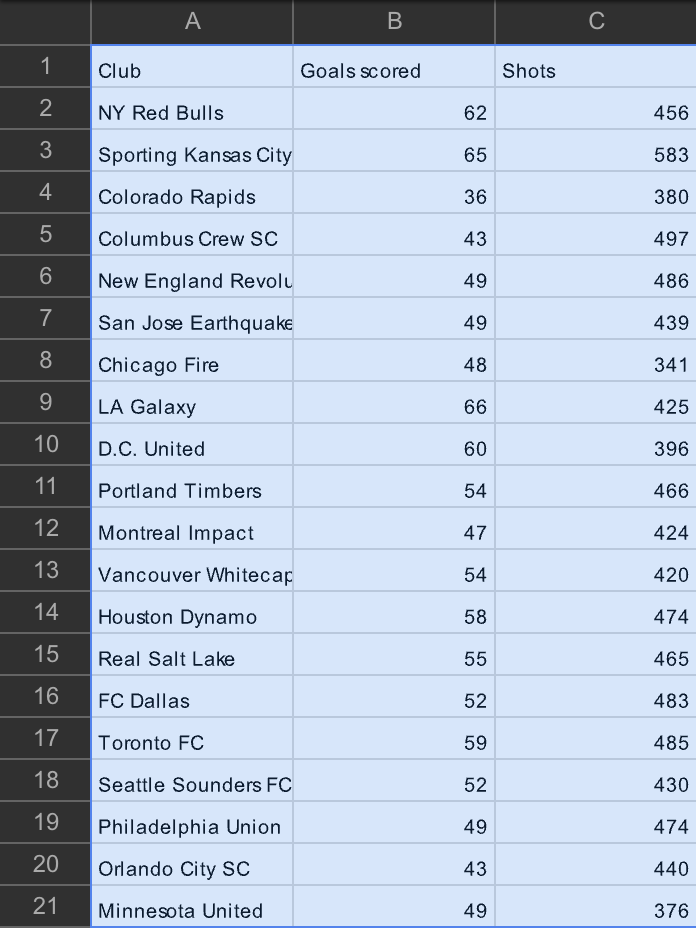
- Use the SoccerData.csv file (located in the Week 1 folder) to complete the following tasks. Note: Up until now, the videos and course material have helped you complete tasks. For the following tasks, you will need to figure this out on your own. Use resources and/or each other. This is a tough exercise!
- Plot the relationship between shots and goals scored. Label the x-axis "Shots" and the y-axis "Goals". Create a main title for the plot titled "Shots vs. Goals". use this reference in your answer: Maskata, B. (2023). Data Analytics with R. In Principles of Data Analytics and Statistical Learning. Springer Nature.
- Add a best-fit line to the scatterplot and make it red.
- Use the cor.test() function to determine if there is a relationship between the two variables. What is the correlation value and what does this mean?
- What is your conclusion? Is there a relationship between shots and scoring goals? Explain.
Responses to Question 1 should be about one (1) page in length, double-spaced. Please include citations in APA style, if applicable. If you are referencing course readings, you can simply reference them in the text (Shmueli et al., 2023). Yes! You can use the readings to answer the questions. You are also welcome to share your own experiences or references but are not required to do so unless stated otherwise.
SoccerData.csv file :
Step by Step Solution
There are 3 Steps involved in it
1 Expert Approved Answer
Step: 1 Unlock

Question Has Been Solved by an Expert!
Get step-by-step solutions from verified subject matter experts
Step: 2 Unlock
Step: 3 Unlock