

Question: a. is this data discrete or continuous? (on the screenshot) b. construct a frequency from 0 to 5 c. construct a relative frequency from 0
a. is this data discrete or continuous? (on the screenshot)
b. construct a frequency from 0 to 5
c. construct a relative frequency from 0 to 5
d. what percentage of households had 3 tvs?
e. which percentage of households had 4 or more tvs?
f. construct a frequency histogram
g. construct a relative frequency histogram
h. what is the shape of the distribution?
thank you for your help
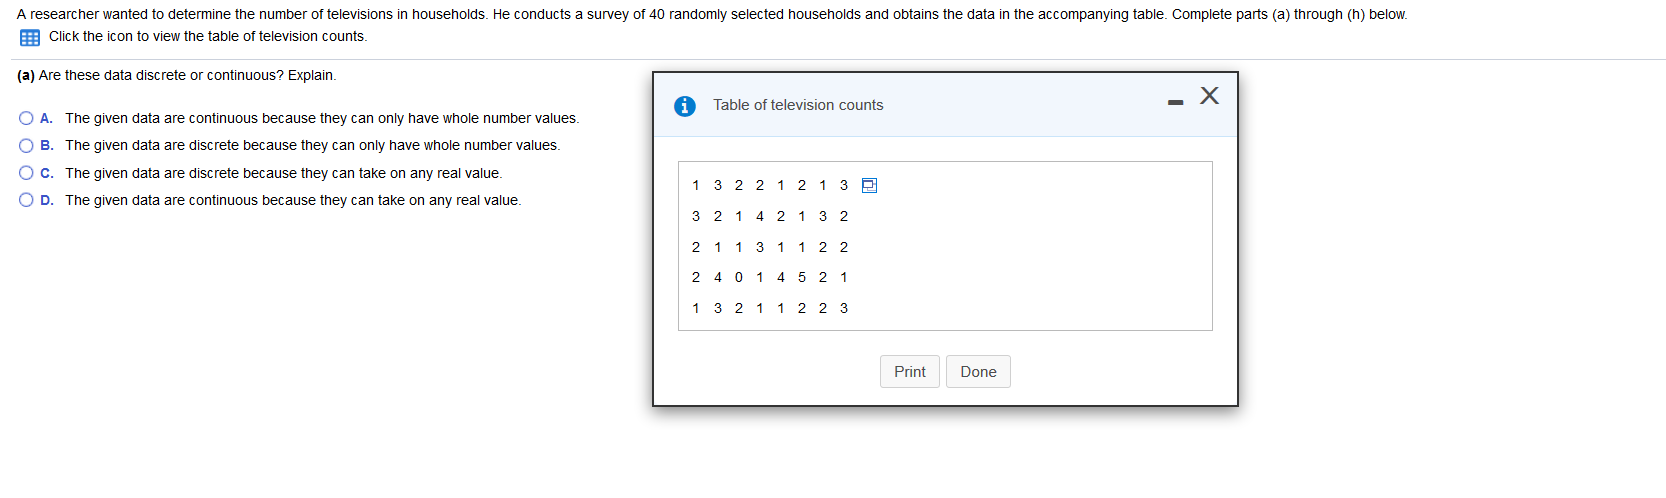
A researcher wanted to determine the number of televisions in households. He conducts a survey of 40 randomly selected households and obtains the data in the accompanying table. Complete parts (a) through (h) below. Click the icon to view the table of television counts. (a) Are these data discrete or continuous? Explain. A. The given data are continuous because they can only have whole number values. i Table of television counts - X O B. The given data are discrete because they can only have whole number values. O C. The given data are discrete because they can take on any real value. O D. The given data are continuous because they can take on any real value. 3 2 2 1 2 1 3 2 3 2 1 4 2 1 3 2 21 131 12 2 2 4 0 1 4 5 2 1 1 3 2 1 1 2 2 3 Print Done
Step by Step Solution
There are 3 Steps involved in it

Get step-by-step solutions from verified subject matter experts