

Question: A L E 1 Little's Law 2 Formulas Throughput (per hour) 40 Flow time (in minutes) 40 Flow time (in hours) #N/A Work-in-process (WIP) #N/A
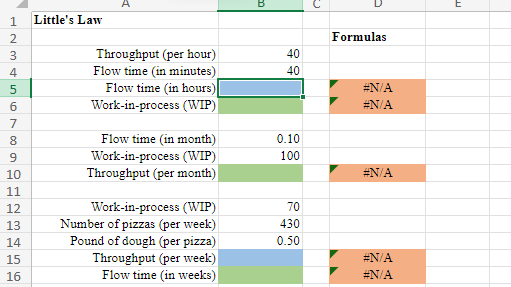
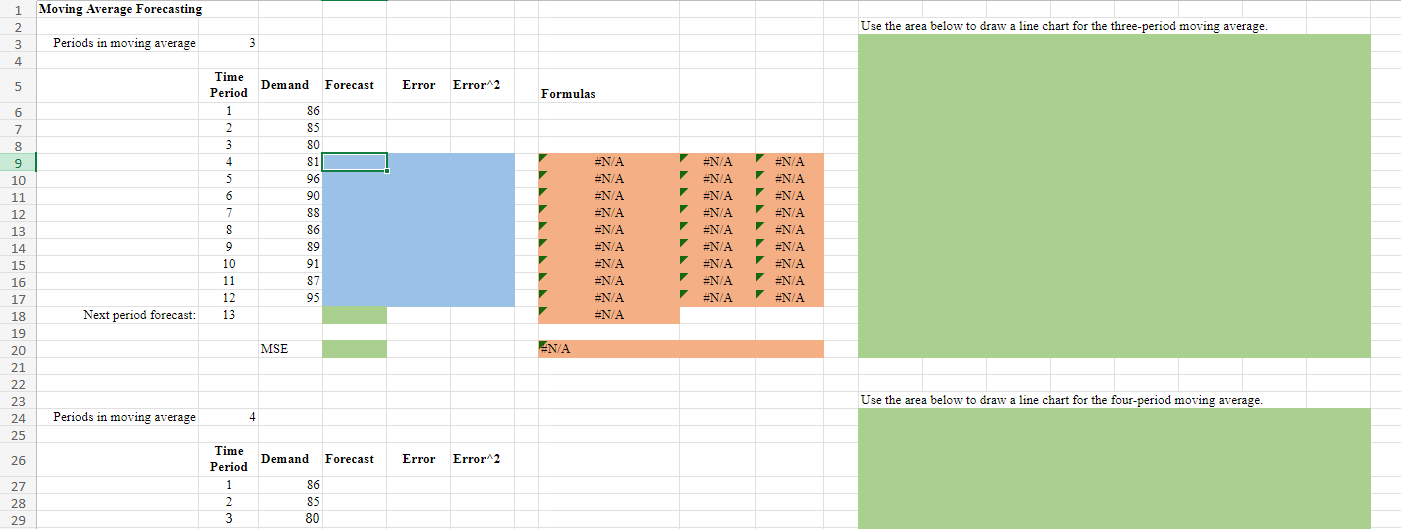
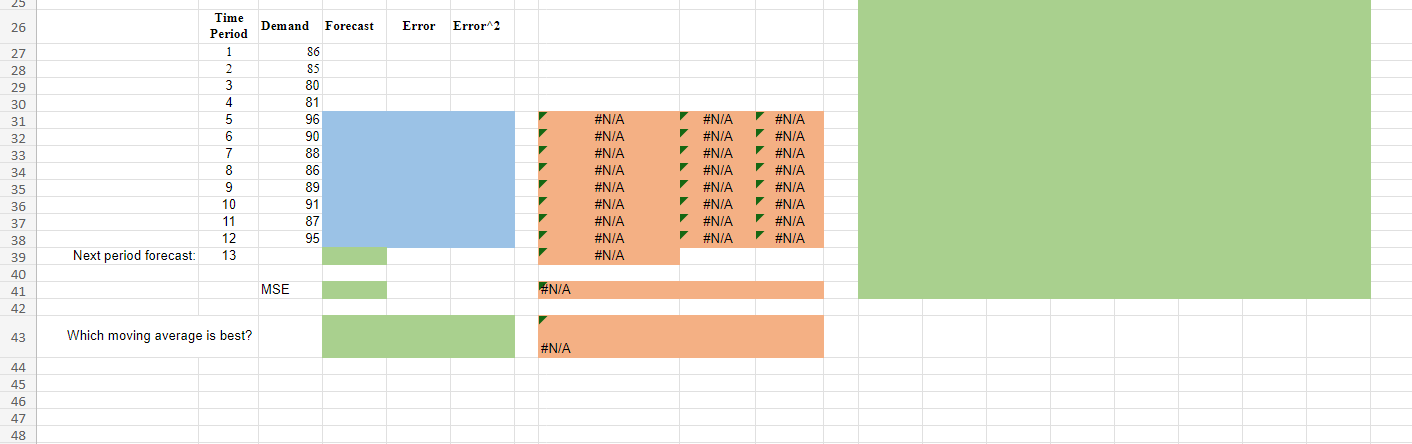
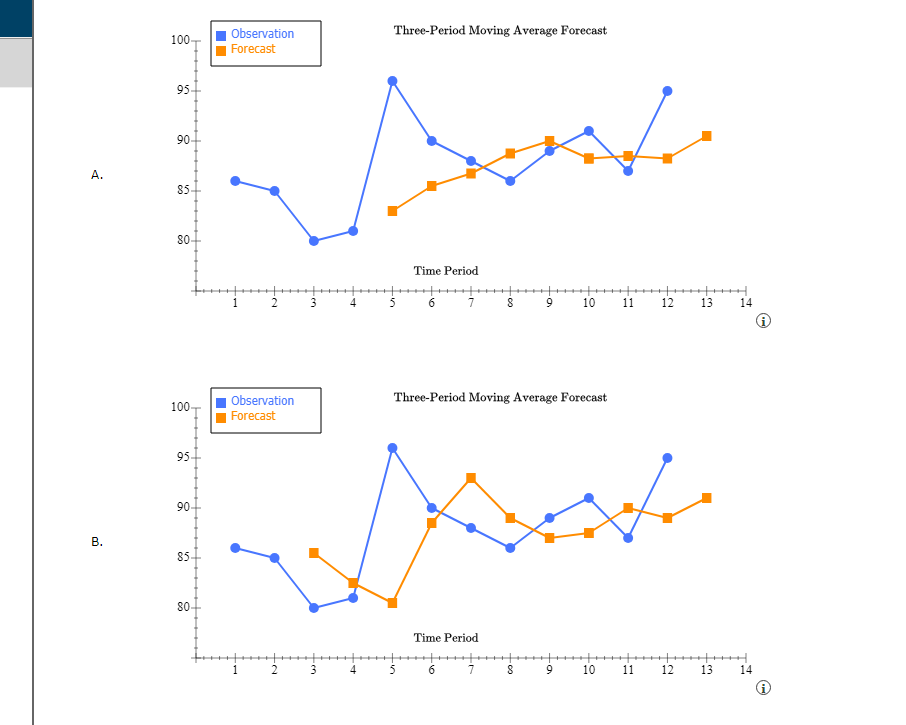
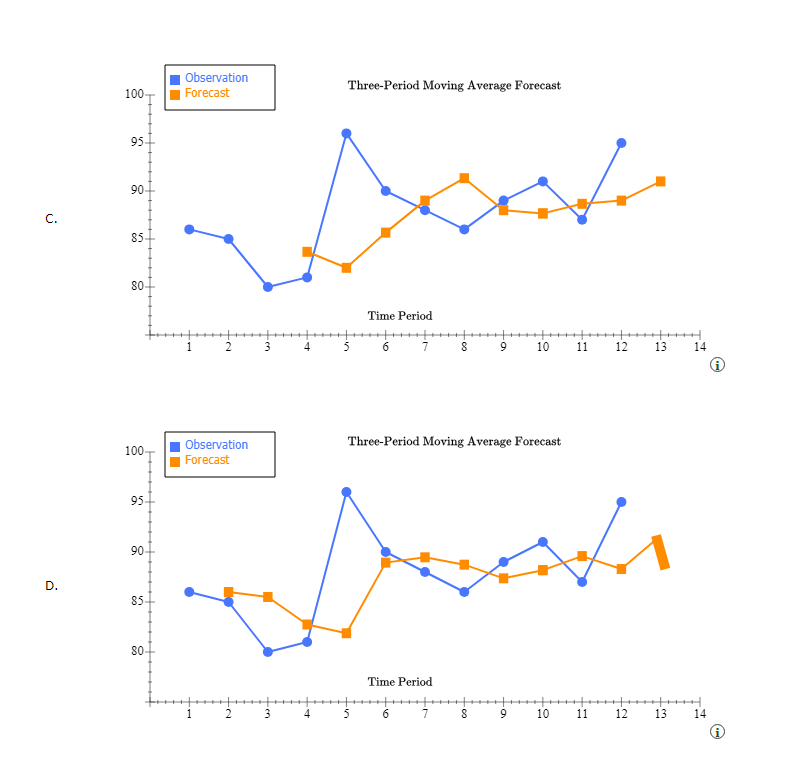
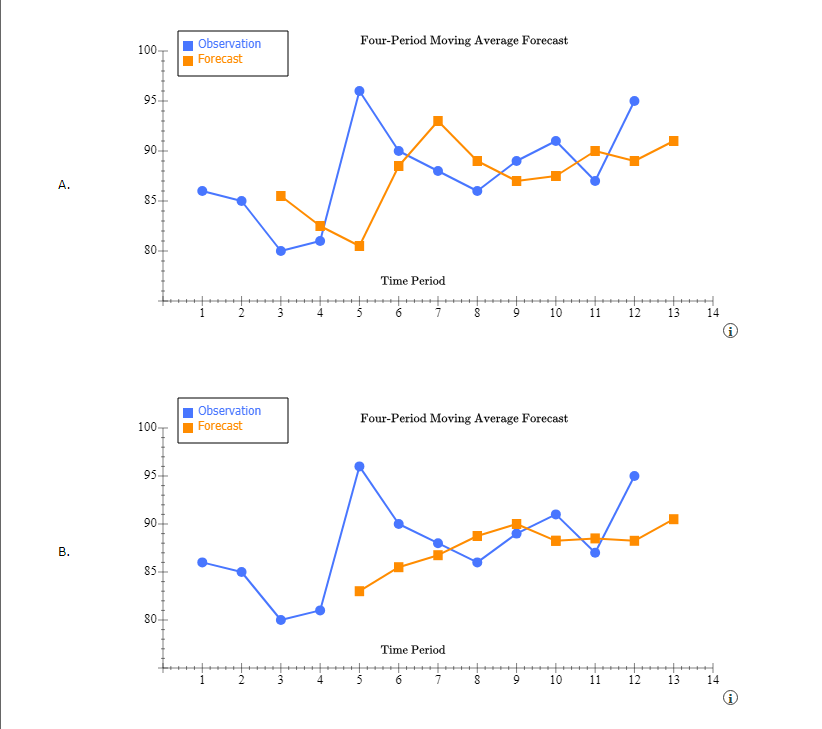
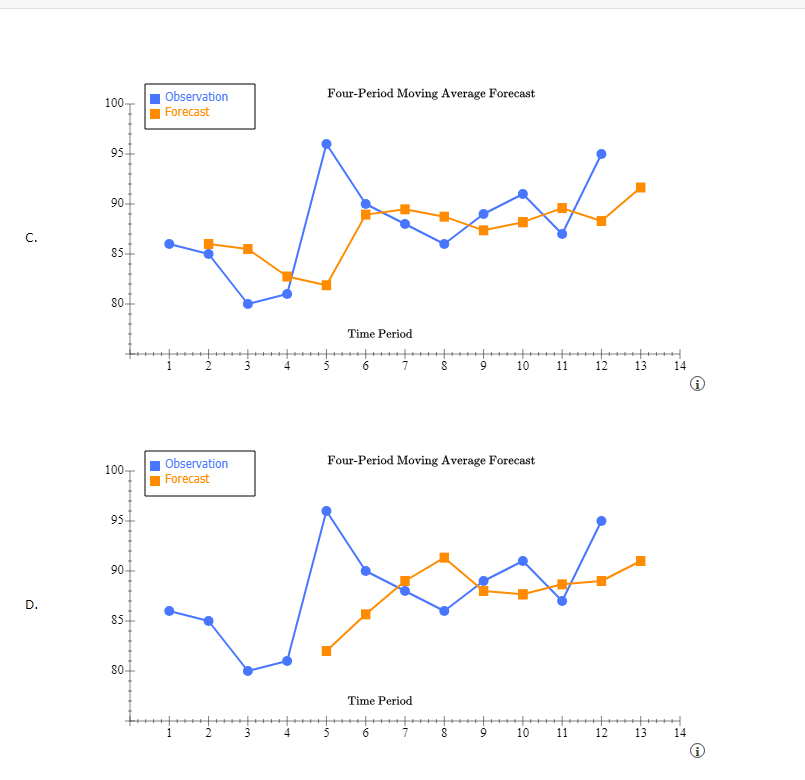
A L E 1 Little's Law 2 Formulas Throughput (per hour) 40 Flow time (in minutes) 40 Flow time (in hours) #N/A Work-in-process (WIP) #N/A Flow time (in month) 0.10 Work-in-process (WIP) 100 10 Throughput (per month) #N/A 11 12 Work-in-process (WIP) 70 13 Number of pizzas (per week) 430 14 Pound of dough (per pizza) 0.50 15 Throughput (per week) #N/A 16 Flow time (in weeks) #N/AMoving Average Forecasting Use the area below to draw a line chart for the three-period moving average. W N Periods in moving average 3 Time un Period Demand Forecast Error Error* 2 Formulas 1 86 85 Co 3 80 4 81 #N/A #N/A #N/A 10 5 96 #N/A #N/A #N/A 11 6 90 #N/A F #N/A #N/A 12 88 #N/A #N/A #N/A 13 86 #N/A #N/A #N/A 14 9 89 #N/A #N/A #N/A 15 10 91 #N/A #N/A #N/A 16 11 87 #N/A #N/A #N/A 17 12 95 #N/A #N/A #N/A 18 Next period forecast: 13 #N/A 19 20 MSE EN/A 21 22 23 Use the area below to draw a line chart for the four-period moving average. 24 Periods in moving average 4 25 Time 26 Period Demand Forecast Error Error 2 27 1 86 28 85 79 8022 26 27 28 29 30 31 32 22 35 36 37 38 g 40 41 42 43 45 46 47 48 Time Period Next period forecast: 13 Which moving average is best? Demand Forecast Error Error'2 MSE 86 85 80 81 96 90 i 86 89 91 a7 95 Observation Three-Period Moving Average Forecast 100- Forecast 95- 90- A. 80 Time Period 14 2 3 4 5 6 7 10 11 12 Three-Period Moving Average Forecast 100- Observation Forecast 95- 90- B. 25- 80- Time Period 2 3 4 5 6 7 S 9 10 11 12 13 141 Observation Forecast Three-Period Moving Average Forecast 100 95- 90-4 C, 80- Time Period 5 6 7 9 10 11 12 13 14 100 observation Three-Period Moving Average Forecast Forecast 95- 90 D. 85. 80- Time Period 6 9 10 11 12 13 14100- Observation Four-Period Moving Average Forecast Forecast 90- A. 85- Time Period 5 6 7 9 10 11 12 13 14 Observation 100 Forecast Four-Period Moving Average Forecast 951 90 B. 80- Time Period 1 2 3 4 5 6 7 9 10 11 12 13 14100- Observation Four-Period Moving Average Forecast Forecast 95-1 90 C. Time Period 6 7 8 10 11 12 13 14 100 Observation Four-Period Moving Average Forecast Forecast 25 20- D. Time Period 3 4 5 6 7 8 9 10 11 12 13 14
Step by Step Solution
There are 3 Steps involved in it

Get step-by-step solutions from verified subject matter experts