

Question: A large corporation is interested in determining wether a relationship exists between the commuting time of its employees and the level of stress- related problems
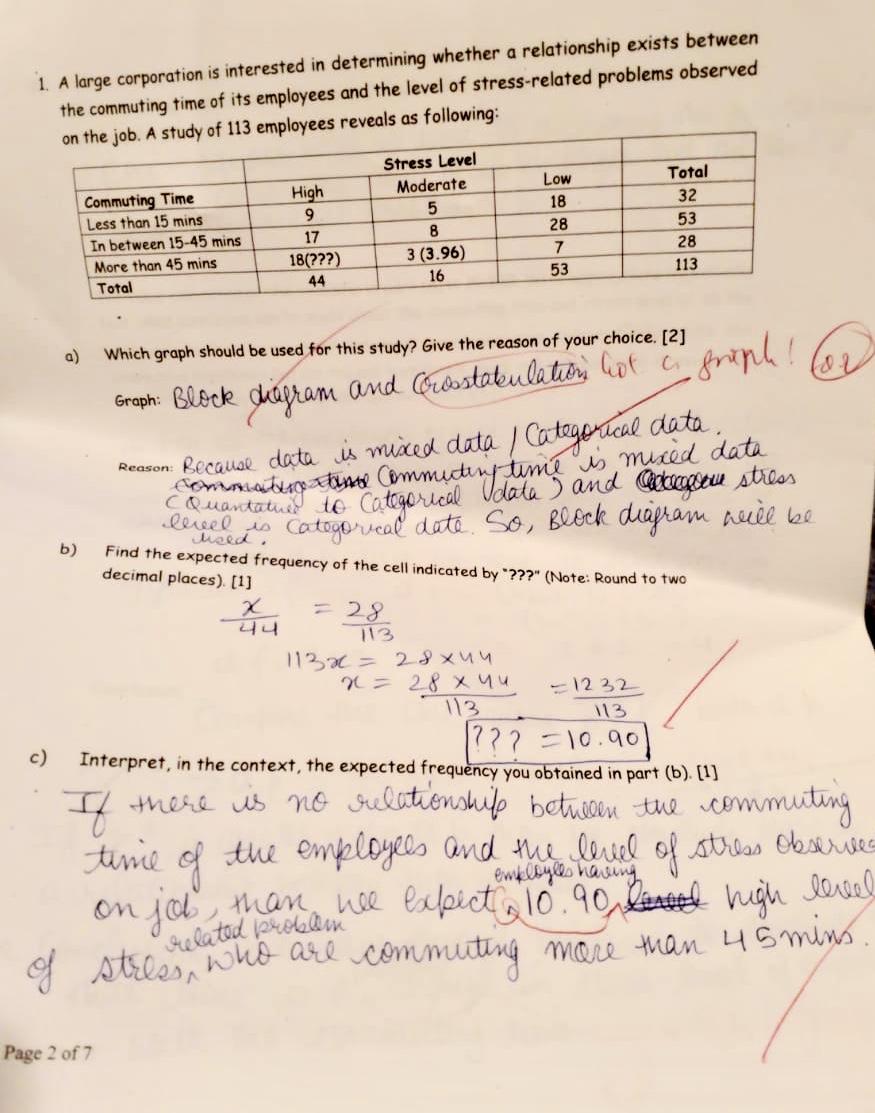
A large corporation is interested in determining wether a relationship exists between the commuting time of its employees and the level of stress- related problems observed on the job. A study of 113 employees reveals as following:
Stress Level
Commuting Time High Moderate Low Total
Less than 15 mins 9 5 18 32
In between 15-45 mins 17 8 28 53
More than 45 mins 18 (???) 3 (3.96) 7 28
Total 44 16 53 113
a) Which graph should be used for the study? Give the reason of your choice.
b) Find the expected frequency of the cell indicated by "???" ( Round to two decimal places)
c) Interpret in the context, the expected frequency you obtained in part (b)
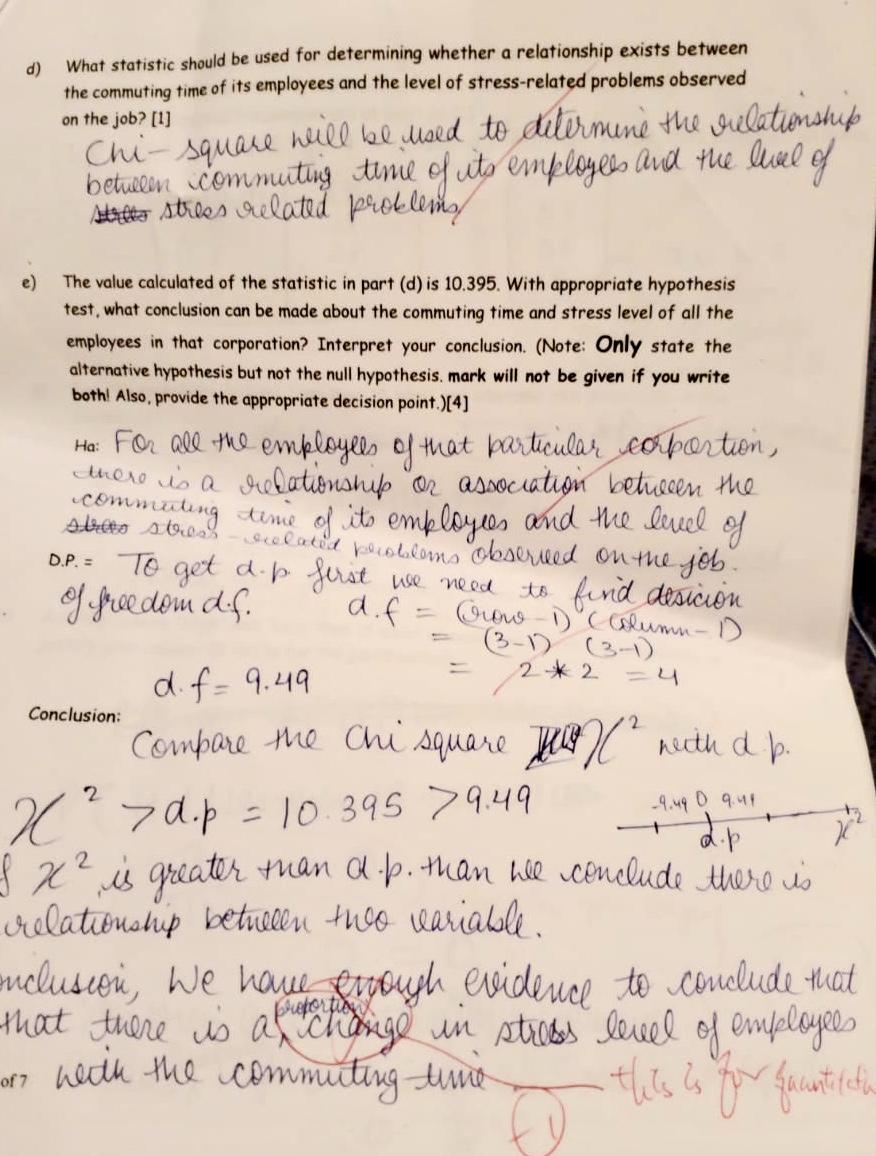
d) What statistic should be used for determining whether a relationship exists between the commuting time of its employees and the level of stress- related problems observed on the job?
e) The value calculated of the statistics in part (d) is 10.395. With appropriate hypothesis test, what conclusion can be made about the commuting time and stress level of all the employees in that corporation? Interpret your conclusion. Provide the appropriate decision point.
Ho: ???
Ha: ???
Decision Point??
Conclusion??
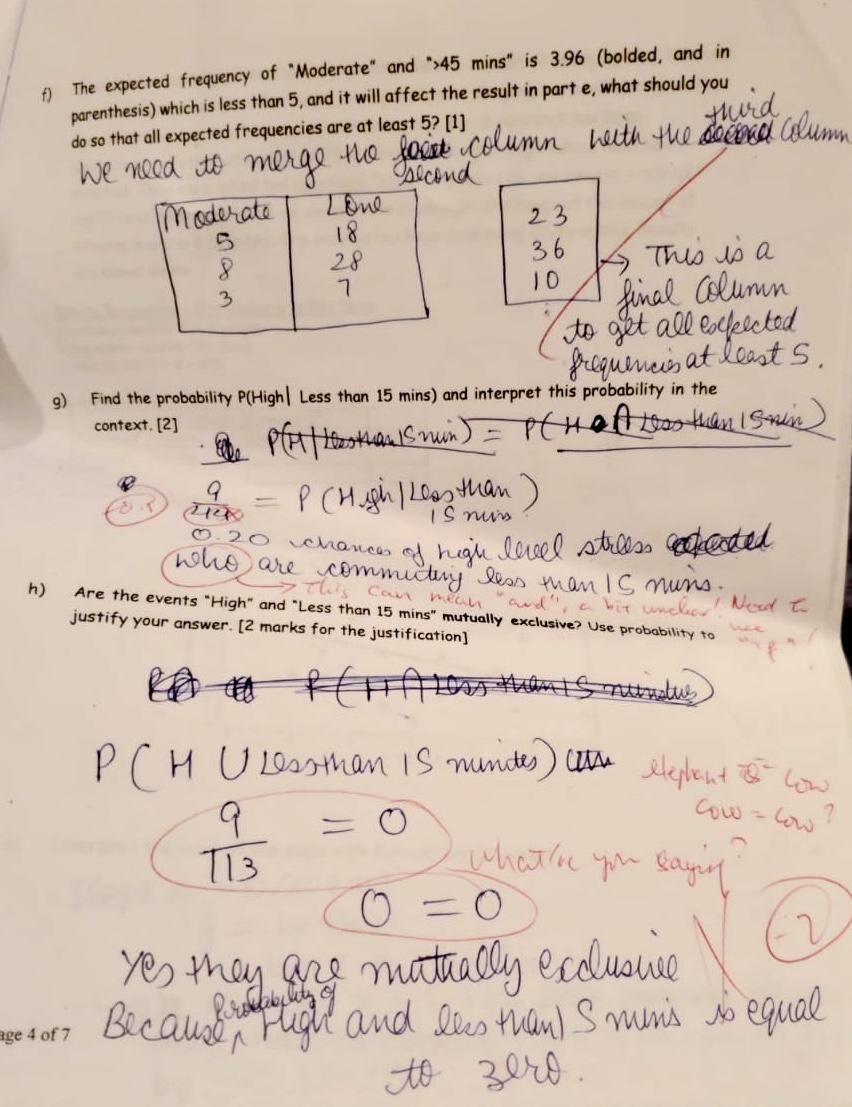
f) The expected frequency of "Moderate" and " > 45 mins" is 3.96 (bolded and in parenthesis) which is less than 5, and it will affect the result in part e, what should you do so that all expected frequencies are at least 5?
g) Find the probability P (High I Less than 15 mins) and interpret this probability in the context.
h) Are the events "High" and "Less than 15 mins" mutually exclusive? Use probability to justify your answer. ( Only need justification)
1. A large corporation is interested in determining whether a relationship exists between the commuting time of its employees and the level of stress-related problems observed on the job. A study of 113 employees reveals as following: Stress Level Commuting Time High Moderate Low Total Less than 15 mins 9 5 18 32 In between 15-45 mins 17 8 28 53 More than 45 mins 18(???) 3 (3.96) 7 28 Total 44 16 53 113 a ) Which graph should be used for this study? Give the reason of your choice. [2] Graph: Block diagram and Cocostatulation lot in graph ! Reason: Because data is mixed data / Categorical data Commato tame Commutiny time is mixed data (Quantatiny) to Categorical Vodata ) and Cavacoeve stress b ) level is categorical date. So, Block diagram meckl be Find the expected frequency of the cell indicated by "???" (Note: Round to two decimal places). [1] X = 28 113 1132 = 28x49 7 = 28 x 4 4 113 = 1232 113 (?? ? = 10.90) c) Interpret, in the context, the expected frequency you obtained in part (b). [1] If there is no relationship between the commuting time of the employees and the level of stress observe employees having on job, than we expect, 10. 90 high level related problems of stress, who are commuting more than 45 mins Page 2 of 7d) What statistic should be used for determining whether a relationship exists between the commuting time of its employees and the level of stress-related problems observed on the job? [1] Chi- square will be used to determine the relationship between commuting time of its employees and the level of stress related problems e) The value calculated of the statistic in part (d) is 10.395. With appropriate hypothesis test, what conclusion can be made about the commuting time and stress level of all the employees in that corporation? Interpret your conclusion. (Note: Only state the alternative hypothesis but not the null hypothesis, mark will not be given if you write both! Also, provide the appropriate decision point.)[4] Ha: For all the employees of that particular corportion, there is a relationship or association between the commuting time of its employees and the level of At stiles - suclater problems observed on the job. D.P. = To get d.p first we need to find desicion of freedom dof. d. f = row-1) (Column - D) (3- 1) (3-1) d. f = 9.49 = 2 * 2 = 4 Conclusion: Compare the Chi square Pig)neith dip. 2 7 d.p = 10. 395 79.49 - 9.49 0 9.41 8 x 2 is greater than ap. than wee conclude there is d.p relationship between two variable. muclusion, We have enough evidence to conclude that that there is as change in stress level of employees or with the commuting time this is for gauntitatif) The expected frequency of "Moderate" and ">45 mins" is 3.96 (bolded, and in parenthesis) which is less than 5, and it will affect the result in part e, what should you do so that all expected frequencies are at least 5? [1] We need to merge the least column neith the second Column third second Moderate WOOD 18 23 28 36 10 - This is a final Column to get all expected 9) frequencies at least S. Find the probability P(High | Less than 15 mins) and interpret this probability in the context. [2] 9 -= P (High / Less than ) 0.20 chances of high level stillas expected who are commuting less man IC muns. This can mean "and', a bit uncher Now I h) Are the events "High" and "Less than 15 mins" mutually exclusive? Use probability to justify your answer. [2 marks for the justification] P C H U Lessthan IS minutes) CHA elephant 8 Low 9 = 0 713 cow = low ? what're you layer 0 = 0 yes they are mutually exclusive 2 age 4 of 7 Because High and less than S min's is equal to zero
Step by Step Solution
There are 3 Steps involved in it

Get step-by-step solutions from verified subject matter experts