

Question: a) Level 1 Analysis - explain how the following analysis was created and analyze it for potential issues raised by the results. McPeters, Inc. Variance
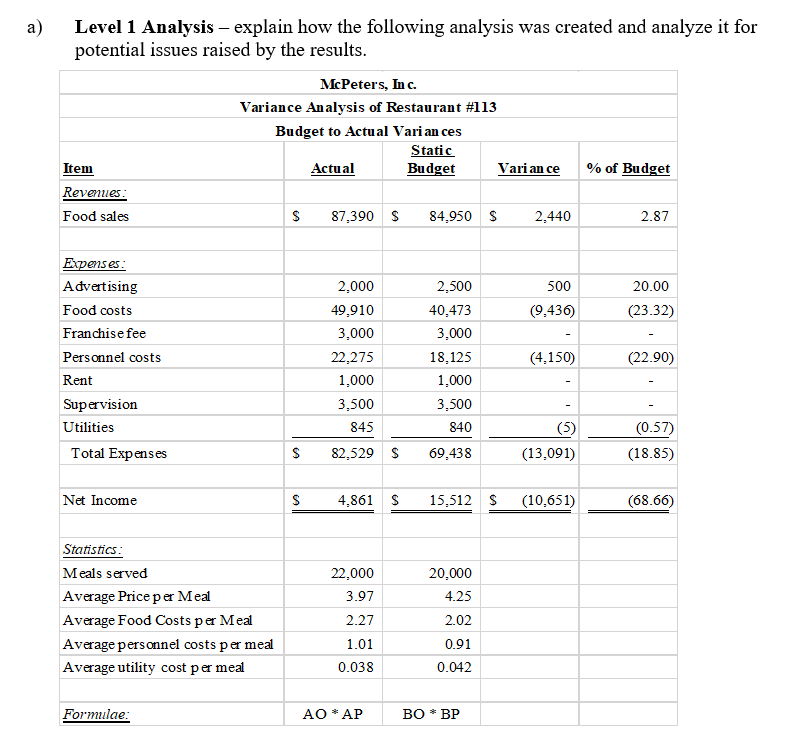
a) Level 1 Analysis - explain how the following analysis was created and analyze it for potential issues raised by the results. McPeters, Inc. Variance Analysis of Restaurant #113 Budget to Actual Variances Static Item Actual Budget Variance % of Budget Revenues : Food sales $ 87.390 $ 84,950 $ 2,440 2.87 500 20.00 (23.32) (9,436) Expenses: Advertising Food costs Franchise fee Personnel costs Rent Supervision Utilities Total Expenses 2.500 40,473 3,000 18.125 1.000 3.500 840 (4.150) 2,000 49.910 3,000 22,275 1,000 3,500 845 82,529 $ (22.90) (5) (13.091) (0.57) (18.85) $ 69.438 Net Income $ 4.861 S 15,512 5 (10.651) (68.66) Statistics : Meals served Average Price per Meal Average Food Costs per Meal Average personnel costs per meal Average utility cost per meal 22.000 3.97 2.27 20,000 4.25 2.02 0.91 1.01 0.038 0.042 Formulae: AO*AP BO * BP
Step by Step Solution
There are 3 Steps involved in it

Get step-by-step solutions from verified subject matter experts