

Question: A line chart shows each data point in proportion to the whole data series as a slice in a circular pie. separates one or more
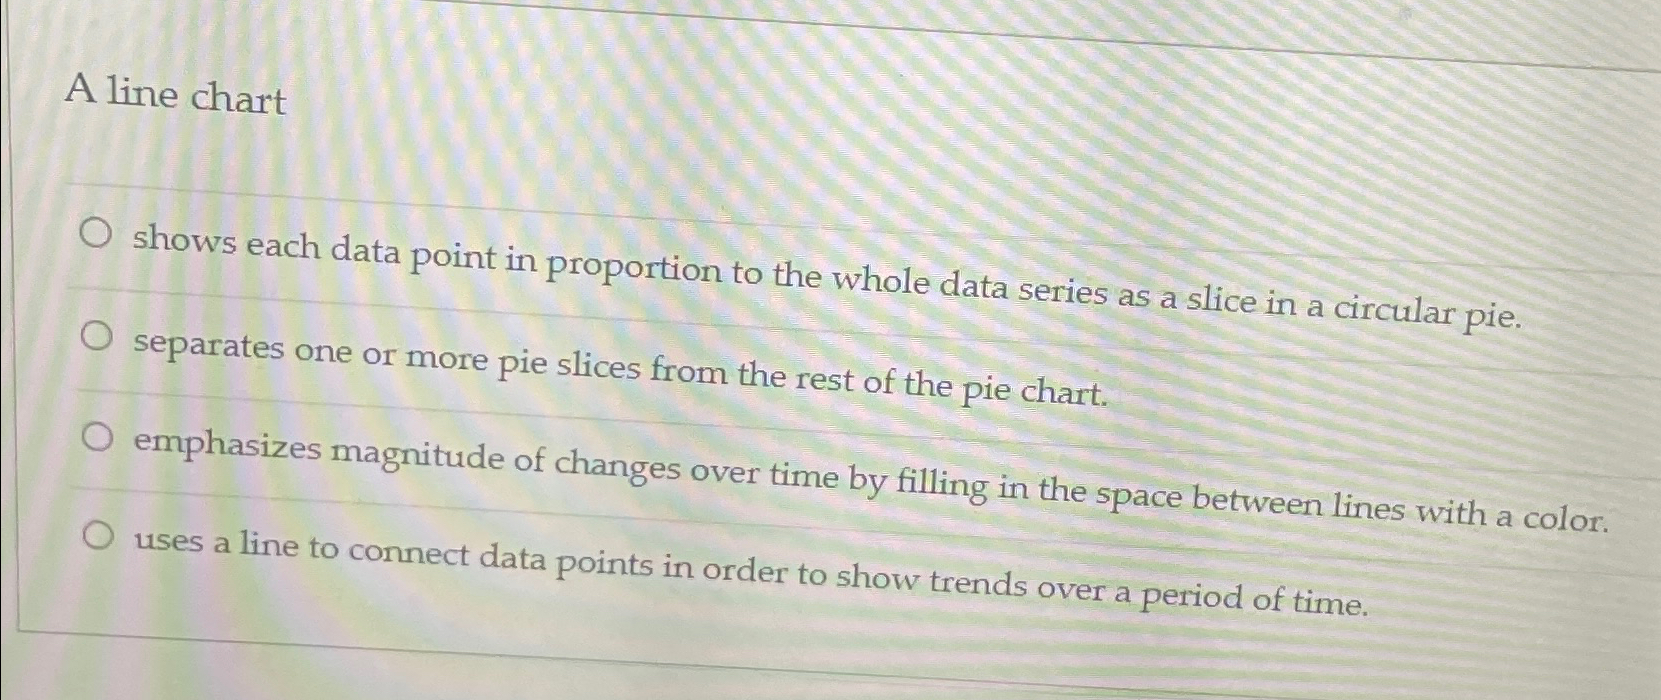
A line chart
shows each data point in proportion to the whole data series as a slice in a circular pie. separates one or more pie slices from the rest of the pie chart.
emphasizes magnitude of changes over time by filling in the space between lines with a color.
uses a line to connect data points in order to show trends over a period of time.
Step by Step Solution
There are 3 Steps involved in it
1 Expert Approved Answer
Step: 1 Unlock

Question Has Been Solved by an Expert!
Get step-by-step solutions from verified subject matter experts
Step: 2 Unlock
Step: 3 Unlock