

Question: A linear function g models a relationship in which the dependent variable increases 2 units for every 1 unit the independent variable increases Graph g
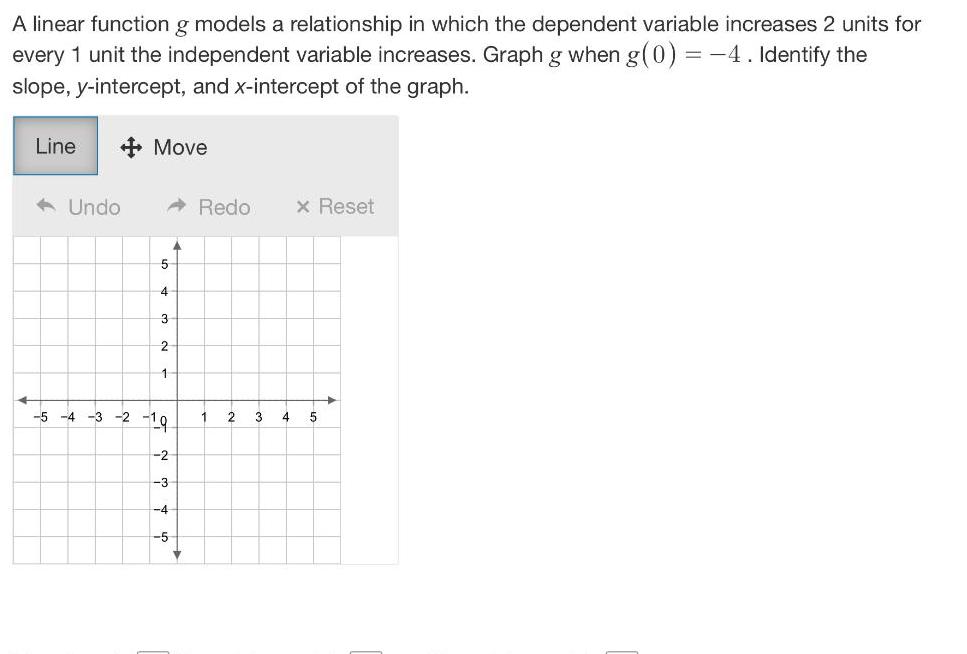

A linear function g models a relationship in which the dependent variable increases 2 units for every 1 unit the independent variable increases Graph g when g 0 4 Identify the slope y intercept and x intercept of the graph Line Move Undo 5 4 3 2 1 5 4 3 2 19 2 3 4 5 Redo 1 2 3 x Reset 4 5
Step by Step Solution
There are 3 Steps involved in it
1 Expert Approved Answer
Step: 1 Unlock

Question Has Been Solved by an Expert!
Get step-by-step solutions from verified subject matter experts
Step: 2 Unlock
Step: 3 Unlock